The three major indices hit new all-time highs last week. Especially, the Dow finally climbed above the 20,000 psychological barrier. Whether this is the breakout that many technicians have been waiting for or just a meaningless number that is no different from, say, Dow 18,456, remains to be seen; but in any case the question that is on all investors’ minds is “What’s next?” If we look back at the Dow’s crossing above 10,000 for the first time in March 1999, then we might be misguided, because the tech bubble was a unique period. The second time the Dow hit 10k is also unlikely to be applicable – that was in October 2009, during the recovery from the financial crisis. Rather than simply cherry-picking a few points, why don’t we take a comprehensive look at the market’s all-time-highs and then try to draw some conclusions? There are two major scenarios: The market tests new highs and then pulls back, or the market continues making new highs. Given that the Dow has relentlessly soared over 1,500 points since the election, we are more interested in the latter scenario.
First, are we due for a correction? Or even a bear market? Although a bear market has occurred every 3.5 years on average since 1990, such a major pullback requires that something fundamentally damaging happen to the market. Hence, if it were going to happen, investors might be able to detect it in advance. A 10% correction comes approximately every five quarters (318 trading days). But such a correction can happen faster than a bear market and without any warning sign, particularly in today’s algorithmic trading world. Fortunately, the stock market doesn’t have a history of 10%–20% fallbacks right after it makes new highs. However, our analysis shows that once the all-time-high party is over, the hangover that follows can hurt. Liquidity is usually high as the market runs through all-time highs. However, once the momentum subsides, liquidity providers tend to take profit off the market quickly. As Figure 1 shows below, once the market has lost momentum and fails to make any more new highs, in the following three months the average return has been -6.55% since 1950.

Figure 1. 3-month return after all-time high lost momentum
Next, the duration of each all-time-high run matters. We define a run as two consecutive new highs occurring no longer than one month apart. Our analysis shows as soon as the run stops, the market reverses quickly. The trend line is negatively sloped from one week to four weeks after the run. The average weekly returns for those four weeks are -2.85%, -3.81%, -4.16%, and -3.87%, respectively. Figure 2 demonstrates those returns. The horizontal axis represents the number of days in each run.
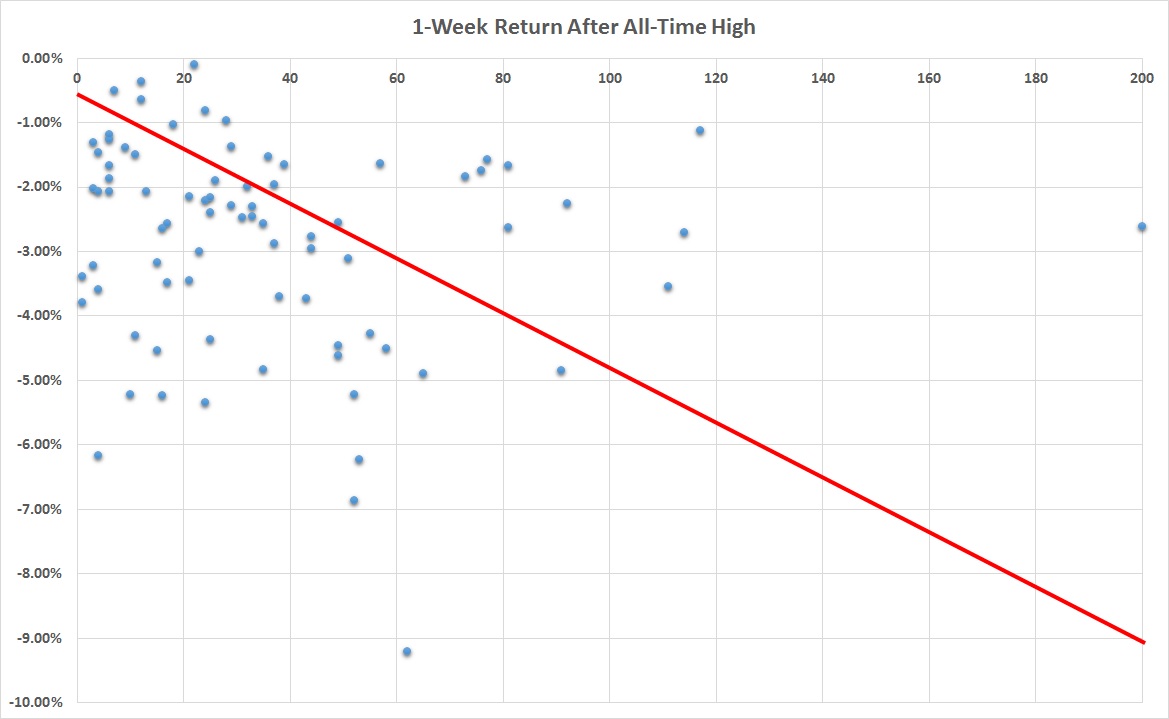
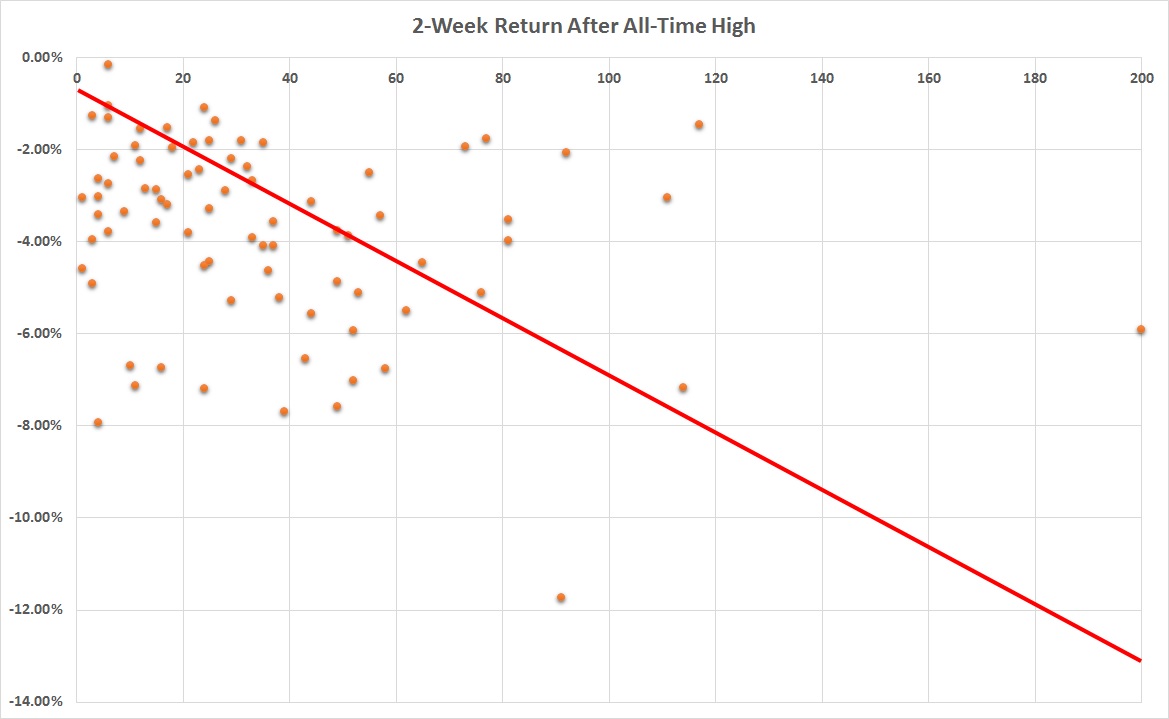
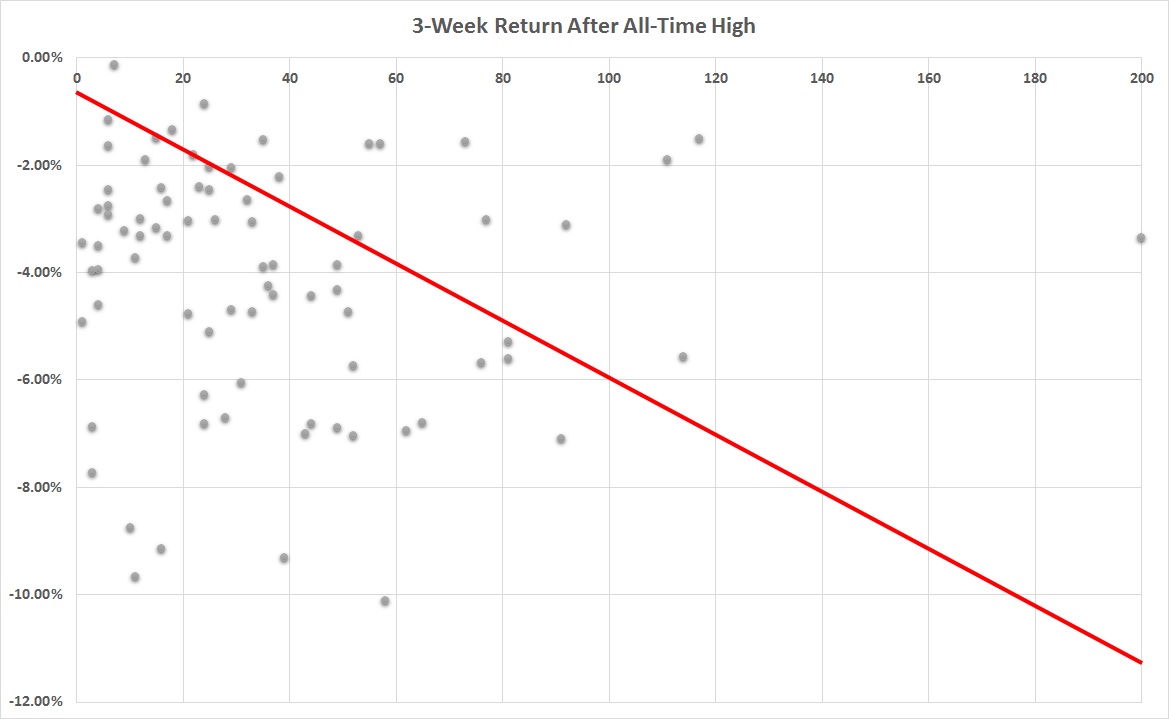

Figure 2. 1-4 week returns after all-time-high run stops
If we shift our focus away from the all-time high to a shorter period, the results continue to point to the downside. For example, since the current bull market started in 2009, there has been a 3%–7% pullback every three months on average after each 90-day high.

Figure 3. 3-month pullbacks since 2009
Although history never repeats in the same way, we would advise investors to be cautious, since we have been in this current all-time-high run for 48 trading days, and the last 5% pullback was three months ago. But, as many would argue, healthy pullbacks will propel the market to rise further in the long run—unless the pullback turns into a bear market.
*Part of our US stock market ETF management strategy involves quantitative work. We share some of it from time to time, as we are doing here; but we must remind clients, consultants, and readers that there are many inputs to a decision to buy, sell, or hold; and no single quantitative method is perfect. For details information, we can discuss these matters with you and provide disclosure information. A simple email request is sufficient.