While investors have been focusing on the strengthening U.S. market, we’ve also kept our eyes on other improving indicators happening in resources, Europe, and emerging markets. These places may not be as widely popular, but we believe investors can benefit greatly from taking a view that’s different from the ones observed by the majority.
No one would disagree that Warren Buffett, a famous contrarian, has been very successful by going against the herd.
A key is in identifying strengths early and using math in your favor. We’ve discussed many of these patterns before:
- Don’t Sell in May: Here are Reasons to Extend Your Stay
- Is Europe Ready to Take Off?
- Two Charts Illustrate How to “Follow the Money”
- 5 China Charts That Look Bullish for Commodities
- Trying to Stop a Bull Market Has Risks
Consider the leadership change in stocks that took place earlier this year. During the last week in April, you’ll recall that U.S. equities bounced back after suffering the worst losses of the year in the previous week, with certain companies taking the lead. Here were our observations from the week’s performance:
“Cyclicals rose this week and noncyclical areas were the laggards, which is a change from recent trends. We potentially could be at an inflection point, as defensive areas such as telecom, staples, healthcare and utilities have outperformed by a wide margin in recent months and mean reversion may kick in as expectations got too lofty for defensives and too gloomy for cyclicals.”
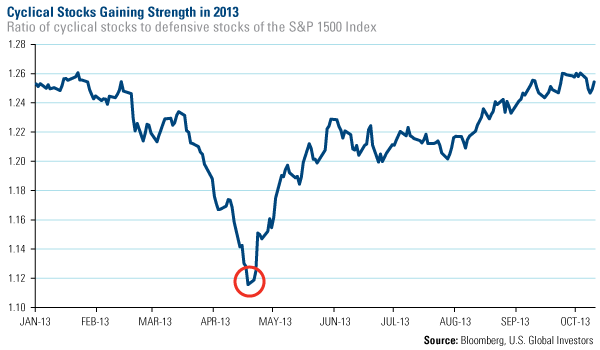
The chart below shows this turn in the market. Until April 23, cyclical sectors were losing strength against defensive areas. Since then, cyclical stocks have been gaining strength and while the path has experienced the occasional stumble, there’s clearly a rising trend.
Also consider China’s government manufacturing purchasing manager’s index (PMI), which rose for the third month in a row in October. Earlier this year, the survey sample was enlarged from 820 to 3,000 companies, so this PMI is generally a good indicator of China’s overall demand.
We closely follow PMIs because they provide a measure of well-being for the manufacturing sector and the economy as a whole. A number above 50 represents expansion, but what’s more important for investors is to pay attention to the close relationship between the trend in PMIs and the resulting performance of commodities and stocks.
It’s a historical fact that in the three months following a “cross above,” there was about a 65 percent probability that commodities and stocks would rise in value.
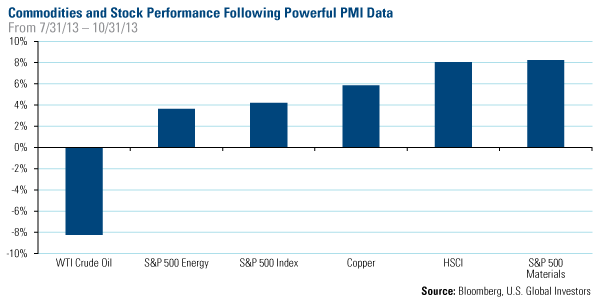
And taking a look at performance from July 31 through October 31 of this year, you can see the trend held for all measures, except for WTI crude oil. Materials stocks in the S&P 500 Index increased the most, rising more than 8 percent, closely followed by the Hang Seng Composite Index.
We believe the strength in these areas of the market is especially encouraging for energy companies, especially those that own high-quality assets in the core basin areas of Eagle Ford, Permian, Marcellus and Bakken. What’s important to our process at U.S. Global is finding oil and gas companies that are growing their reserves, production and cash flows on a per share basis.
In An American Energy Revolution, we mentioned Pioneer Natural Resources (PXD), the oil and gas company based in Irving, Texas, which has key assets in Eagle Ford shale and Permian Basin. Often discussed as an acquisition target by a major oil company, it has been a large holding for the Global Resources Fund (PSPFX). On a year-to-date basis, the stock has increased 92.6 percent.
There’s also Enterprise Products Partners (EPD), which is a midstream MLP with a dividend yield of 4.4 percent. Based in Houston, it's one of the biggest and most successful MLPs over the last decade. It dominates the processing, transportation and storage of natural gas liquids, which is growing rapidly from the rapid development of U.S. and Canadian oil & gas shale plays. MLPs is one significant emerging energy theme the fund managers have been capitalizing on and on a year-to-date basis, EPD has increased 32 percent.
Valero Corp. (VLO) is another Texas-based stock in the energy space. Valero is the largest independent refiner in the U.S., with operations in Canada and Europe. Cheap natural gas and discounted oil from shale and oil sands give Valero a competitive edge compared to its global peers. In addition, its complex Gulf Coast refineries are exporting record fuel volumes to rapidly growing emerging markets. VLO has rewarded investors with a 33 percent return, year-to-date.
I’ve discussed many times the potentially greater returns from energy companies, but the major difference between an investor gaining from the opportunities or missing it is in taking action today. What action will you take?
Please consider carefully a fund’s investment objectives, risks, charges and expenses. For this and other important information, obtain a fund prospectus by visiting www.usfunds.com or by calling 1-800-US-FUNDS (1-800-873-8637). Read it carefully before investing. Distributed by U.S. Global Brokerage, Inc.
Past performance does not guarantee future results.
Foreign and emerging market investing involves special risks such as currency fluctuation and less public disclosure, as well as economic and political risk. Because the Global Resources Fund concentrates its investments in a specific industry, the fund may be subject to greater risks and fluctuations than a portfolio representing a broader range of industries.
All opinions expressed and data provided are subject to change without notice. Some of these opinions may not be appropriate to every investor. There is no guarantee that the issuers of any securities will declare dividends in the future or that, if declared, will remain at current levels or increase over time.
The Purchasing Manager’s Index is an indicator of the economic health of the manufacturing sector. The PMI index is based on five major indicators: new orders, inventory levels, production, supplier deliveries and the employment environment. The S&P 500 Stock Index is a widely recognized capitalization-weighted index of 500 common stock prices in U.S. companies. The S&P 500 Energy Index is a capitalization-weighted index that tracks the companies in the energy sector as a subset of the S&P 500. The S&P 500 Materials Index is a capitalization-weighted index that tracks the companies in the material sector as a subset of the S&P 500. The S&P 1500 Composite is a broad-based capitalization-weighted index of 1500 U.S. companies and is comprised of the S&P 400, S&P 500, and the S&P 600. The Hang Seng Composite Index is a market capitalization-weighted index that comprises the top 200 companies listed on Stock Exchange of Hong Kong, based on average market cap for the 12 months.
Holdings in the Global Resources Fund as a percentage of net assets as of 9/30/13: Pioneer Natural Resources 2.36%, Enterprise Products Partners 2.18%, Valero 0.00%
