
Over the past few months, investors have seen better economic data coming out of Europe. Consumer confidence in the continent has been rising, manufacturing data is improving and the fiscal situation is on the mend. Now, China appears to be strengthening as well, which could signal better times ahead.
Below are five charts that I believe look bullish for China and commodities. While not meant to be comprehensive, they do point to areas where investors might want to pay close attention.
1. Economic Surprise Indices Improved in the U.S., Euro and China
An increasing amount of economic data releases are beating analysts’ expectations in the U.S. and Europe. In recent months, the three-month change in the economic surprise index for the U.S. has climbed considerably higher. It’s the same story for Europe.
These developments are positive for China as well because, as I have previously indicated, Europe and the U.S. are China’s largest export trading partners, and therefore, these areas have a large impact on the Asian country’s economic health.
Now, the economic surprise index in China is moving up to the “neutral zone,” says BCA Research. As a result, “China-sensitive commodity prices have risen,” says BCA, with A-shares, Chinese container freight traffic and spot iron ore prices all looking encouraging. 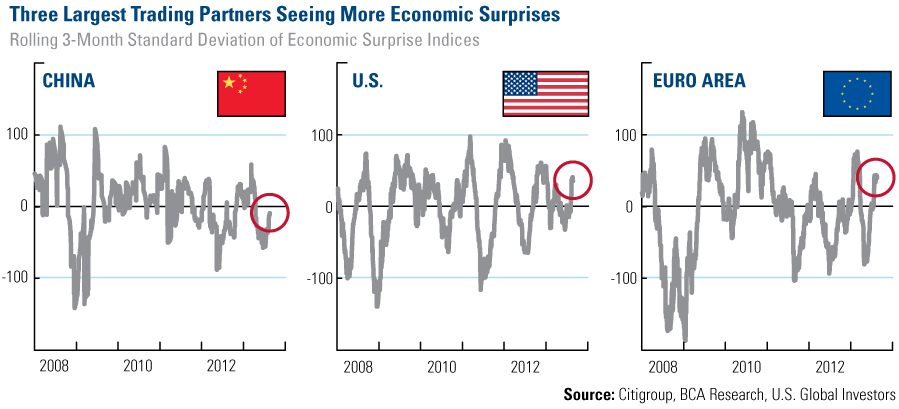
2. Huge Jump in Flash HSBC China PMI
On Thursday, the Flash HSBC China Purchasing Manager’s Index (PMI) climbed to 50.1, which beat Bloomberg’s consensus of 48.2. This improvement in manufacturing data was largely driven by domestic demand, as all sub-indices rose except for new export orders.
Our research has shown that this move is positive for commodities. When the current number moves above the three-month moving average, it has historically signaled higher prices for crude oil as well as many energy and materials stocks over the following three months.  3. Rising Copper Imports into China
China is no longer reducing its inventory of many Chinese commodities, as imports of copper are on the rise, according to BCA. As you can see in Weldon’s chart below, in July, copper imports rose to more than 400,000 metric tons. This was the third month in a row that we saw rising Chinese imports.
As a result of this stronger import data, in addition to declining inventories, the price of copper climbed to the highest level since May. 
4. China’s Crude Oil Imports Climbed to Record High
Crude oil imports also rose, climbing to a record high in July. Wood Mackenzie calculated that if oil imports continue rising, China could overtake the U.S. as the top oil importer by 2017, says Reuters. 
5. China Continues Growth-Friendly Policies
Investors who followed the incredible infrastructure boom throughout China in the last decade may be waiting for that to happen again. Growth won’t happen at the same pace, as Beijing is very comfortable with its country’s slower rate and does not intend to introduce dramatic stimulus as it has in the past.
That doesn’t mean commodities won’t be in demand. The government will continue its investments in infrastructure, focusing on China’s transformation into a consumption-based economy. Improving income growth, urbanization, economic rebalancing and the well-being of its citizens are among the leaders’ goals.
As one example of the “growth-friendly policies,” BCA points out the massive increase in the country’s urban subway systems, as the “length of light rail and metro will be extended by 40 percent in the next two years, and tripled by 2020,” says BCA. 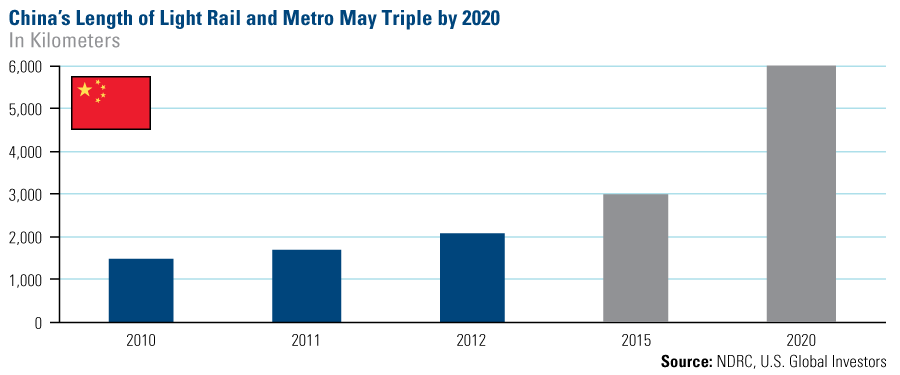
China is not the only important factor driving resources. Here’s another key indicator to watch for commodities.
All opinions expressed and data provided are subject to change without notice. Some of these opinions may not be appropriate to every investor.
The Citi Economic Surprise Index is a measure that tries to capture how well the data is coming in relative to economic expectations. The HSBC Flash China Manufacturing PMI is published a week ahead of the final HSBC China PMI every month. It analyzes 85-90 percent of the responses to the Final PMI from purchasing executives in more than 400 small, medium and large manufacturers, both state-owned and private enterprises. Standard deviation is a measure of the dispersion of a set of data from its mean. The more spread apart the data, the higher the deviation. Standard deviation is also known as historical volatility.
- English (UK)
- English (India)
- English (Canada)
- English (Australia)
- English (South Africa)
- English (Philippines)
- English (Nigeria)
- Deutsch
- Español (España)
- Español (México)
- Français
- Italiano
- Nederlands
- Português (Portugal)
- Polski
- Português (Brasil)
- Русский
- Türkçe
- العربية
- Ελληνικά
- Svenska
- Suomi
- עברית
- 日本語
- 한국어
- 简体中文
- 繁體中文
- Bahasa Indonesia
- Bahasa Melayu
- ไทย
- Tiếng Việt
- हिंदी
5 China Charts That Look Bullish For Commodities
Published 08/27/2013, 11:43 AM
Updated 07/09/2023, 06:31 AM
5 China Charts That Look Bullish For Commodities
Latest comments
Loading next article…
Install Our App
Risk Disclosure: Trading in financial instruments and/or cryptocurrencies involves high risks including the risk of losing some, or all, of your investment amount, and may not be suitable for all investors. Prices of cryptocurrencies are extremely volatile and may be affected by external factors such as financial, regulatory or political events. Trading on margin increases the financial risks.
Before deciding to trade in financial instrument or cryptocurrencies you should be fully informed of the risks and costs associated with trading the financial markets, carefully consider your investment objectives, level of experience, and risk appetite, and seek professional advice where needed.
Fusion Media would like to remind you that the data contained in this website is not necessarily real-time nor accurate. The data and prices on the website are not necessarily provided by any market or exchange, but may be provided by market makers, and so prices may not be accurate and may differ from the actual price at any given market, meaning prices are indicative and not appropriate for trading purposes. Fusion Media and any provider of the data contained in this website will not accept liability for any loss or damage as a result of your trading, or your reliance on the information contained within this website.
It is prohibited to use, store, reproduce, display, modify, transmit or distribute the data contained in this website without the explicit prior written permission of Fusion Media and/or the data provider. All intellectual property rights are reserved by the providers and/or the exchange providing the data contained in this website.
Fusion Media may be compensated by the advertisers that appear on the website, based on your interaction with the advertisements or advertisers.
© 2007-2024 - Fusion Media Limited. All Rights Reserved.