The main event of yesterday's trading was the rapid rise of the British pound after the statement of the main EU negotiator on Brexit Michel Barnier that the negotiations have reached the final stage. According to Barnier, the EU is ready to offer Britain a deal on unique terms. The news led to a weakening of the US dollar in the foreign exchange market. As a result, the negative information background for the American currency continues. The strong statistics on US GDP for the 2 quarter (the value was 4.2% (qtr. /qtr.)), which was published yesterday, was ignored by the players. In my opinion, the lack of proper attention to the published statistics of the US economy, which shows an increasing differential in the pace of development of the world's leading economies,, should, in the medium term, affect the strengthening of the US dollar. At the moment, we can only suppose what will serve as a trigger for that. Perhaps this will be facilitated by the introduction of previously announced customs duties on Chinese goods in the amount of $ 200 billion.
Today, the focus of the players in the economic calendar will be the following data:
- 10:55 Moscow time, data on the German labor market (prediction - neutral impact on the market);
- 12:00 Moscow time, index of business and consumer confidence in the euro area (prediction - weakening of European currencies against the US dollar);
- 15:00 Moscow time, consumer inflation in Germany (prediction - neutral impact on the market);
- 15:30 Moscow time, index of spending on personal consumption in the US (prediction - better than market expectations - strengthening of the US currency);
- 15:30 Moscow time, data on Canada's GDP for the 2nd quarter (prediction - worse than market expectations).
Today is expected the correction movement in the foreign exchange market. The US dollar can win back yesterday's losses. The proposed charts show the probable trajectories of the quotes movement and the support and resistance zones.
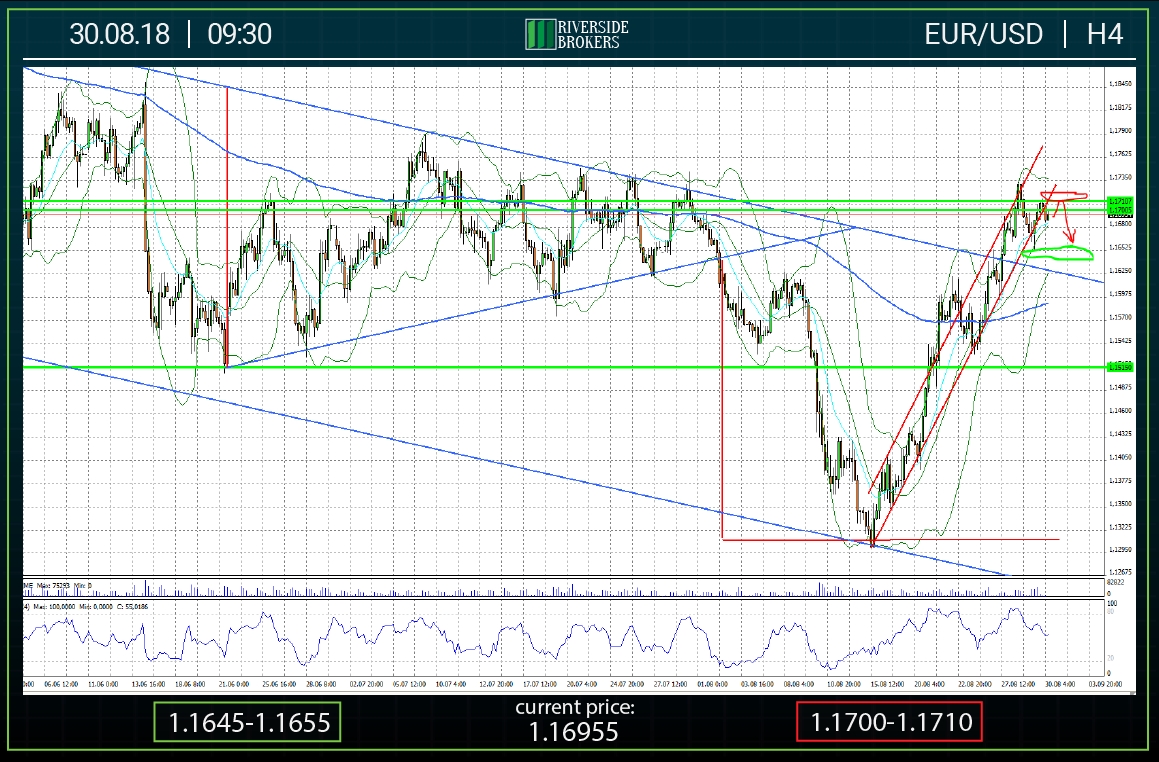
The weakening of the US dollar in yesterday's trading did not affect the EUR/USD pair, which during the last few trading sessions cannot overcome the resistance zone in the area of 1.1700-1.1710. From my point of view, the statistics published today for Germany and the EU will be worse than market expectations, which will lead to quotes in the area located just above the upper limit of the medium-term declining channel.
The support zone is present in the range 1.1645-1.1655 (green oval on the chart) through which the 200-periodic MA (time-frame H4) passes.
The resistance is still in the area of 1.1700-1.1710
GBP/USD
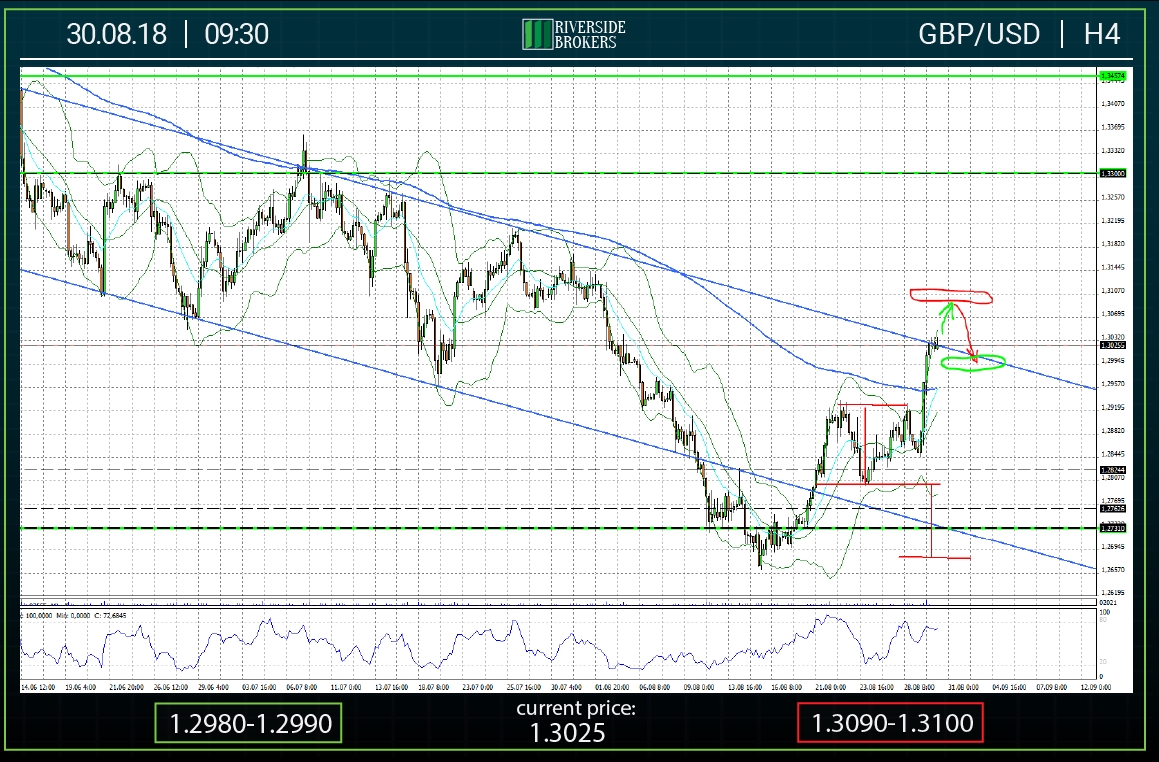
The news of progress in the Brexit negotiations, sounded yesterday by Michel Barnier, led the pair GBP/USD to the upper boundary of the medium-term channel near the 1.3025 mark. The rapid growth of the British pound was the reaction of the markets to the announcement of Michel Barnier, which speaks of the unique proposal made by the EU. Surprisingly, the figure of 85% is present in the messages. I would like to know how this value was obtained, and what is hidden in the remaining 15% (as in the anecdote: «The report about the death was an exaggeration").
Joking aside, today the pair is expected to return to the area below the level of 1.3000.
The support zone is present in the area of 1.2980-1.2990.
Resistance is in the area of maximum prices on July 30-August 1 in the range of 1.3090-1.3100.
USD/JPY
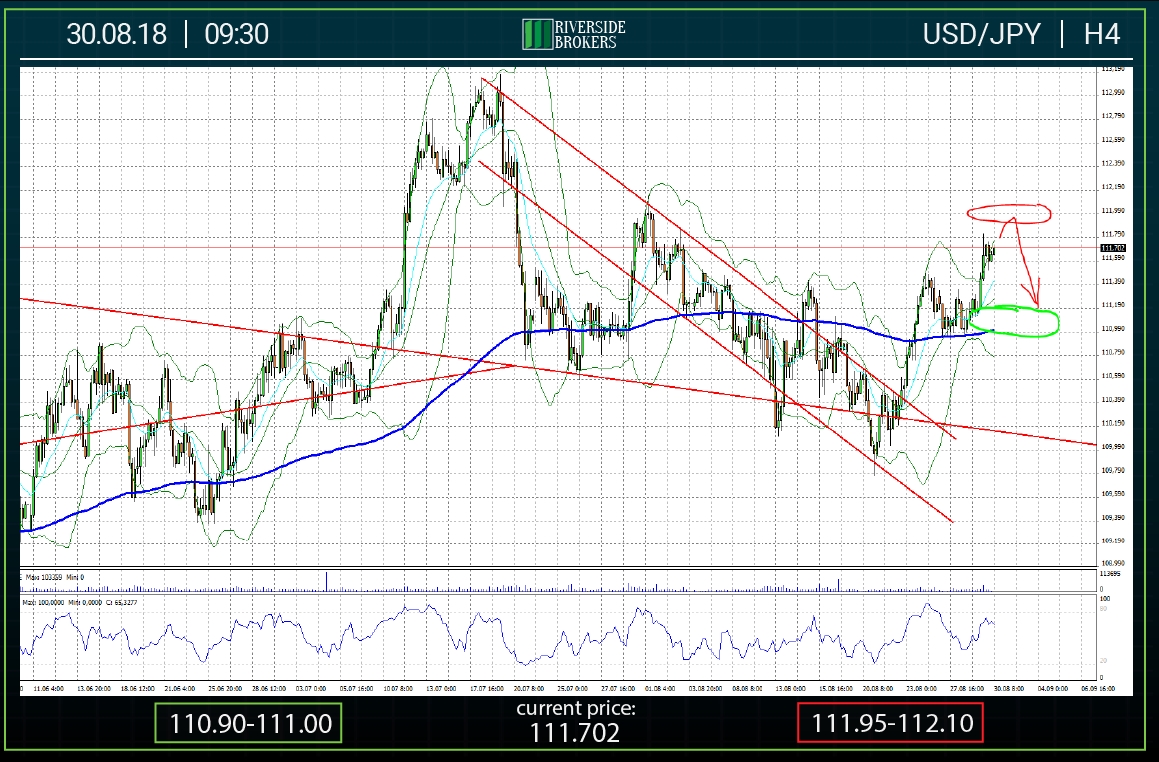
The rise in risk appetite in yesterday's trading session allowed the quotes pair USD/JPY to reach the level of 111.80.
Today, prices are expected to stabilize and return to the area, based on 200-periodic MA for H1 and H4, passing through the mark 110.90.
Players will prefer to take a cautious position before tomorrow's publication of a large block of the Japanese economy’s data.
The support zone is present in the range 110.90-111.00 (green oval on the chart).
The zone of resistance is in the area of the maximum prices of the end of July - beginning of August 111.95-112.10.
USD/CHF
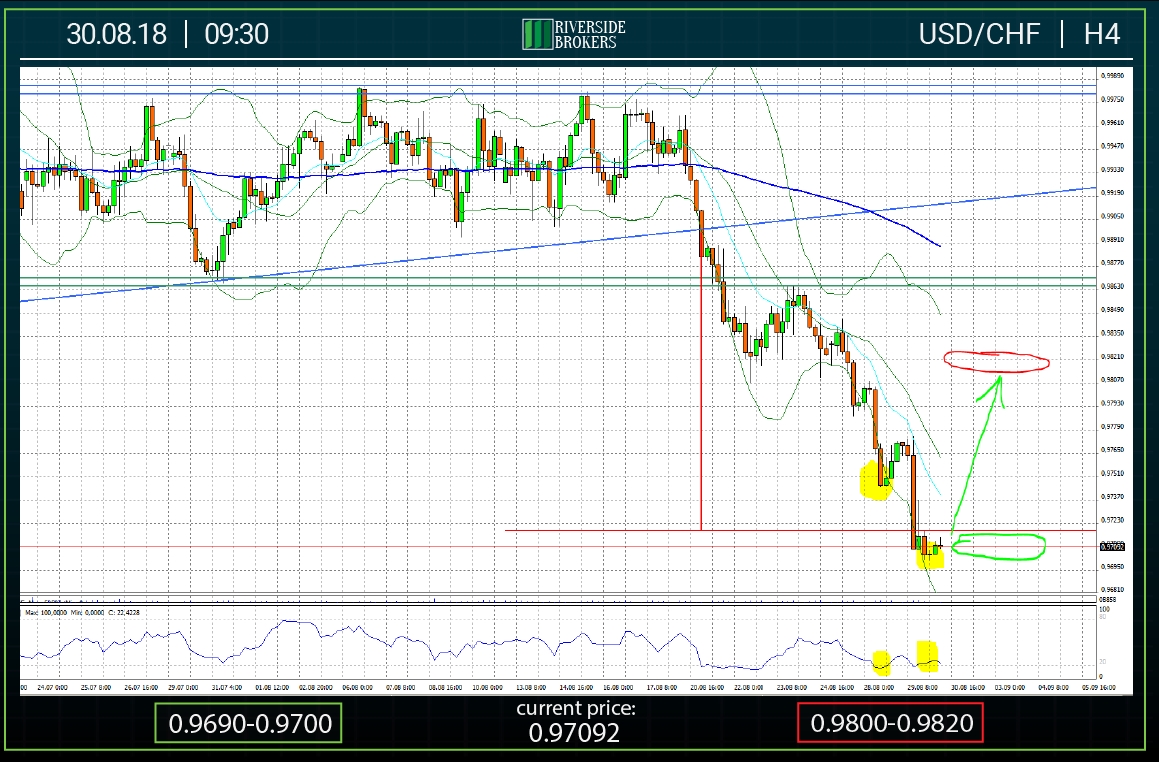
The continued weakening of the U.S. dollar has led the pair USD/CHF around 0.9700. Thus, the price has broken down the level 0.9720 (objective reduction according to the triangle).
In the attached graph, the yellow marker highlights the areas of decreasing local minima, which were accompanied by increasing values of RSI (convergence is observed). At the same time, this situation is typical not only for the H4 timeframe, but also for the timeframes of large and smaller scales. On the basis of this, the beginning of positive dynamics of quotations is foreseen with the aim of growth of 0.9800-0.9820 (more than 100 points from the current prices).
The support zone is located in the area of 0.9690-0.9700 (green oval on the chart).
Local resistance is present in the range of 0.9800-0.9820.


