
Dollar Tree Inc. (NASDAQ:DLTR) posted second-quarter fiscal 2017 results, wherein both the top line and bottom line improved year over year and came ahead of the Zacks Consensus mark. The solid results and confidence in the second half encouraged management to raise its outlook for fiscal 2017.
The company’s shares are up about 8.6% in the pre-market trading session following the better-than-expected results. While Dollar Tree has dropped 6.6% in the last six months, it has performed better than the industry, which tumbled 9.9%.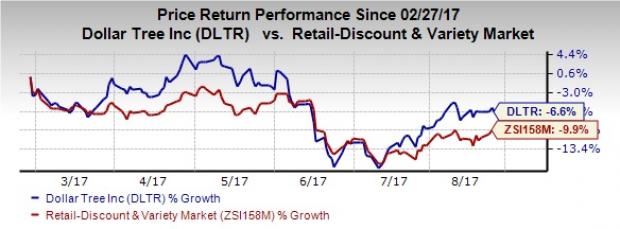
Quarter in Detail
The company’s quarterly adjusted earnings of 99 cents per share jumped 37.5% year over year, and came way ahead of the Zacks Consensus Estimate of 87 cents. Moreover, earnings exceeded the higher end of company’s guidance range of 80-88 cents per share.
Dollar Tree, Inc. Price, Consensus and EPS Surprise
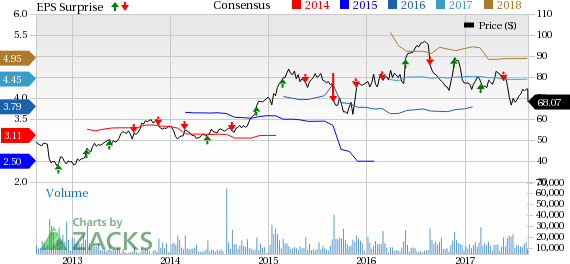
Dollar Tree, Inc. Price, Consensus and EPS Surprise | Dollar Tree, Inc. Quote
Including one-time items like the receivable impairment charge associated with Dollar Express, the company’s earnings surged 36.1% to 98 cents per share.
Consolidated net sales advanced 5.7% to $5,281.2 million in the quarter, surpassing the Zacks Consensus Estimate of $5,230 million.
Comparable store sales (comps) for the quarter increased 2.4%, backed by improved customer count and average ticket. While Dollar Tree banner posted comps growth of 3.9%, comps at the Family Dollar banner climbed 1%.
The company’s quarterly gross profit advanced 7.6% year over year to $1,627.8 million, with the gross margin expanding 50 basis points (bps) to 30.8%. The margin enhancement was driven by reduced merchandise and freight expenses and lower markdowns, partly negated by greater distribution and occupancy expenses.
Selling, general and administrative expenses dropped 20 bps to 22.9% of sales, thanks to reduced depreciation, payroll, employees’ compensation and utility expenses. This was somewhat offset by increased advertising and legal costs, which resulted in greater operating and corporate costs.
Balance Sheet
Dollar Tree ended the quarter with cash and cash equivalents of $693.3 million, net merchandise inventories of $2,928.5 million, net long-term debt of $5,595.0 million and shareholders’ equity of $5,860.2 million.
Store Update
Dollar Tree opened 133 outlets, expanded or relocated 31 outlets, and shuttered 34 outlets during the quarter.
Looking Ahead
Management remains pleased with its quarterly performance, which witnessed improved margins and comps. Also, adjusted earnings surpassed the higher end of the company’s predicted range, with sales at the higher end of the company’s projected band. Further, the company is progressing quite well with Family Dollar’s integration, and remains confident of its second-half performance. This also encouraged management to raise its guidance for fiscal 2017.
Management now forecasts net sales for fiscal 2017 (which will contain an additional week) in the band of $22.07-$22.28 billion, compared with the old projection of $21.95-$22.25 billion. The guidance stems from square footage growth estimate of 3.9% and comps improvement expected in low single-digits.
Earnings per share for fiscal 2017 are now expected to be in the range of $4.44-$4.60, which includes a receivable impairment charge of 14 cents spent in the first half of fiscal 2017. Earlier, management projected earnings in a band of $4.17-$4.43 per share for fiscal 2017. The impact on sales and earnings from the 53rd week is included in management’s outlook. The current Zacks Consensus Estimate for fiscal 2017 is pegged at $4.45.
For the fiscal third quarter, consolidated sales are projected in the range of $5.20-$5.29 billion, driven by comps growth in a low single-digit rise range for the combined entity. Earnings are anticipated in the range of 83-90 cents per share. The current Zacks Consensus Estimate for the third quarter is pegged at 85 cents.
Dollar Tree currently carries a Zacks Rank #3 (Hold).
Interested in Retail? 3 Picks You Can’t Miss
Big Lots Inc. (NYSE:BIG) , with long-term EPS growth rate of 13.5% and a solid earnings surprise history carries a Zacks Rank #2 (Buy). You can see the complete list of today’s Zacks #1 Rank (Strong Buy) stocks here.
Burlington Stores Inc. (NYSE:BURL) also with a Zacks Rank #2, has long-term growth rate of 15.9%.
Ross Stores Inc. (NASDAQ:ROST) is another solid bet as it has a spectacular earnings surprise history, along with long-term growth rate of 10.4%. The company sports a Zacks Rank #2.
One Simple Trading Idea
Since 1988, the Zacks system has more than doubled the S&P 500 with an average gain of +25% per year. With compounding, rebalancing, and exclusive of fees, it can turn thousands into millions of dollars.
This proven stock-picking system is grounded on a single big idea that can be fortune shaping and life changing. You can apply it to your portfolio starting today.
Dollar Tree, Inc. (DLTR): Free Stock Analysis Report
Ross Stores, Inc. (ROST): Free Stock Analysis Report
Big Lots, Inc. (BIG): Free Stock Analysis Report
Burlington Stores, Inc. (BURL): Free Stock Analysis Report
Original post