Huge inventory draw saves crude’s blushes as a stronger dollar twists the knife in gold’s side.
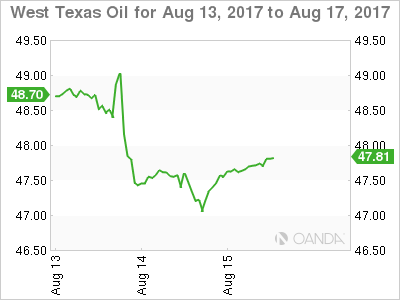
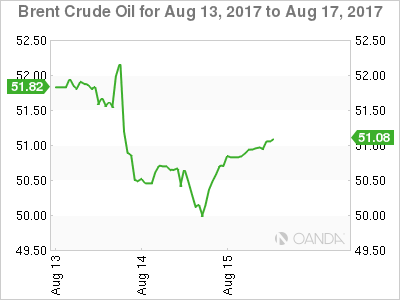
The American Petroleum Institute (API) rode to oil’s rescue overnight reporting a massive 9.2 million barrel drawdown in inventories against an expected 3.6 million barrels. Ahead of this number both Brent and WTI had been under heavy selling pressure from stale long positioning against a backdrop of falling China demand and increased OPEC and U.S. shale production.
Both contracts rallied some two percent off their lows to close up around 0.50% on the day. The technical picture, however, differs slightly with WTI, in particular, most certainly not out of the woods.
Most notable is that the rally in WTI spot failed at its 100-day moving average at 47.85 with the contract limping along in early Asia just below at 47.65. A failure to regain this level today could imply more short-term pain ahead with the next meaningful support at 47.00 and then 46.20.

Brent spot painted a slightly rosier picture, breaking its 100-day moving average at 50.50 but rallying back to close comfortably above it at 50.90 in early Asia. Brent has nearby resistance at 51.00 with a double bottom at 49.90 now must hold support.

All eyes will now turn to tonight’s official U.S. Crude Inventory report with the street hoping that it too follows the API figures and reports a significant drawdown. This would take the pressure off crude in the short term with a disappointing number seeing longs heading for the exit door en masse.
Gold
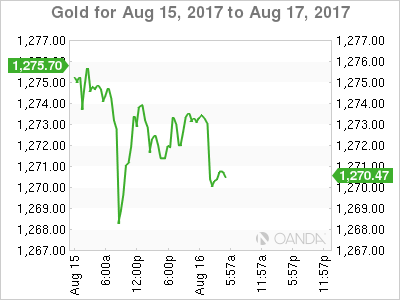
It was another tough night for gold as it fell 15 dollars to 1267.00 at one stage, before dusting itself off and climbing back to 1273 where it traded in early Asia. The good news hasn’t lasted long however as gold has been under constant selling pressure in Asian time, falling to 1270.50.
The U.S. dollar at its highest levels in three weeks following hawkish Fed comments and decent retail sales data overnight. This saw U.S. bond yields rise across the curve which almost always torpedoes gold prices below the waterline. A perceived decline in North Korean tensions has temporarily removed the risk aversion premium loaded into recent gold pricing.
Gold has initial resistance just above present levels at 1274.20 followed by 1282.00 with support at the overnight low of 1267.00 and then 1260.00. The must hold level continues to be the 100-day moving average, today at 1255.00.

