• Dollar retreats as Fed officials refrain adding new hints on Dec. rate hike Several Bank officials spoke on Thursday and the bottom line was held unchanged, the Fed is most likely headed toward its first rate increase in almost a decade, while the ECB is preparing more measures to boost the Eurozone’s recovery. ECB President Draghi noted that the downside risks stemming from global growth and trade are “clearly visible” underlining the Bank’s readiness to unleash further stimulus measures at its meeting next month. On the other side of Atlantic, Fed officials refrained from adding fresh hints regarding December rate hike, with Fed Chair Yellen not even commenting on monetary policy. I believe that the most notable comment came from New York Fed President William Dudley who said that the risks of moving too quickly vs too slowly are nearly balanced. The importance of his assessment comes from the fact that he has been cautious to comment on raising rates and now it seems that more Fed officials are been lined up behind a December rate hike.
• The greenback retreated against its major counterparts as the market was eager for reassurance and stronger signs that the Fed will raise rates at its December meeting. As a result, it has become more sensitive to dovish and neutral comments than hawkish remarks. We have made the case several times that USD is data-driven and that significant positive US data surprises are now required to keep the Fed on track to raise rates and USD to gain further. What is more, with the market currently pricing around 70% rate liftoff in December, it will need fresh communicate from Fed officials to signal a greater probability of hiking as we go into next month’s meeting.
• Today’s highlights: The preliminary GDP data for Q3 from Italy and Eurozone as a whole are due to be released. Eurozone’s preliminary GDP is expected to have risen at the same pace as in Q2, while figures released from Germany and France earlier, were in line with market consensus. The market reaction was muted on the news
• In the US, headline retail sales are expected to have accelerated in October, while retail sales excluding autos and gasoline are estimated to have risen after staying unchanged in September. Further improvement in retail sales could suggest a pick-up in growth for Q4 and could strengthen the greenback further. We also get the PPI data for October. The headline rate is forecast to have declined further into negative territory, while the core figure, excluding food and energy, is expected to have slowed. These data increase the likelihood of a negative surprise in the CPI prints coming out next week. The headline CPI rate is currently at 0.0% yoy with expectations at +0.1% yoy. A possible disappointment in the PPI could leave the CPI rate unchanged. The preliminary U of M consumer sentiment index for November is also coming out along with the surveys of 1-year and 5-to-10-year inflation expectations.
• As for the speakers, ECB Vice-President Vitor Constancio, ECB executive Board member Yves Mersch, and Cleveland Fed President Loretta Mester speak.
The Market
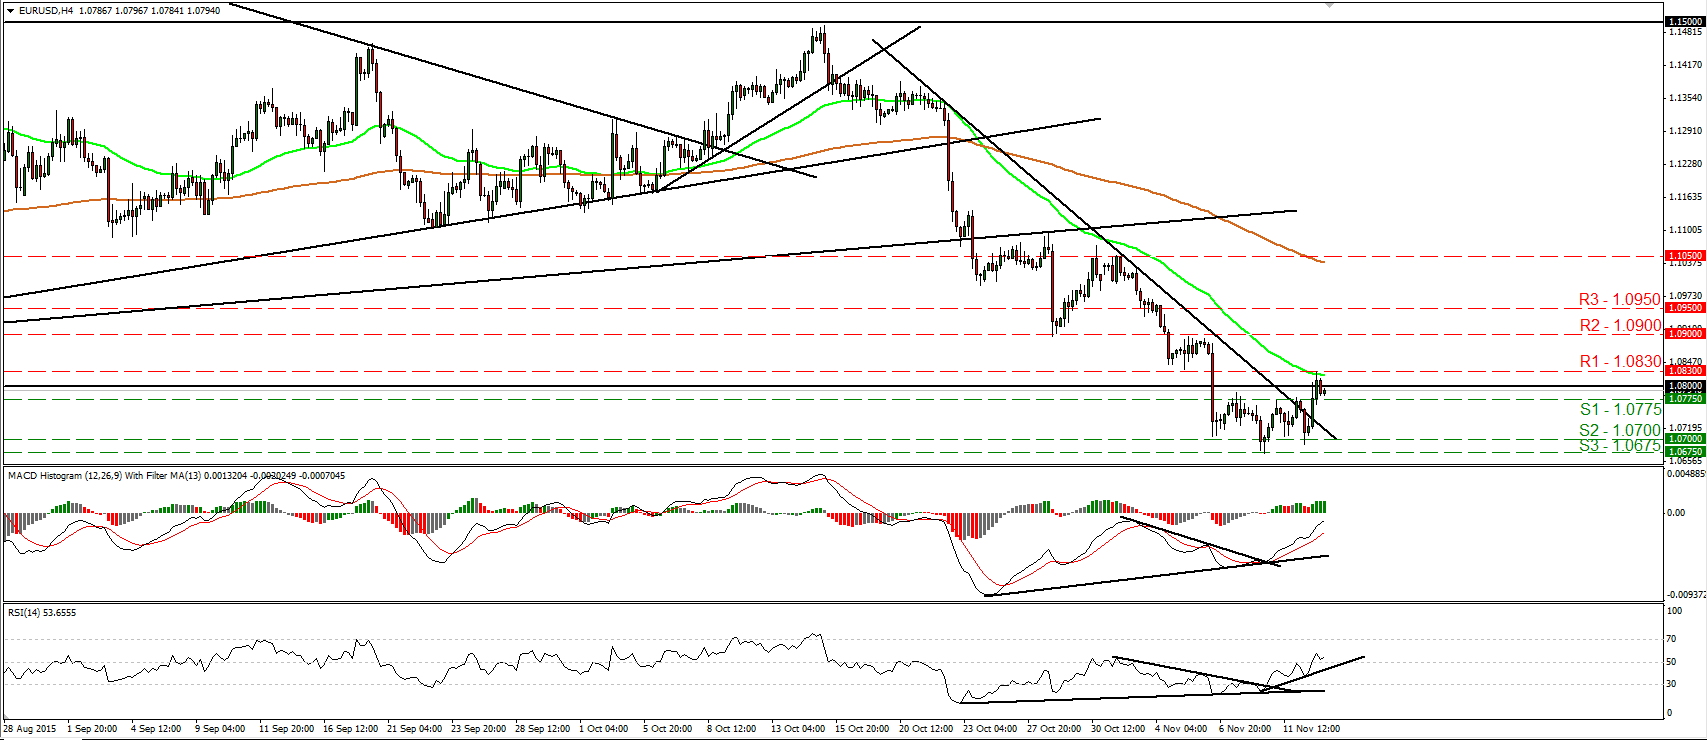
EUR/USD trades higher and hits 1.0830
• EUR/USD traded higher on Thursday, moved back above 1.0800, and hit resistance at 1.0830 (R1). I still believe that at some point the pair will turn down and that it will trade lower in the foreseeable future, but given that the rate is trading above the downtrend line taken from the peak of the 21st of October, I believe that the current rebound may continue for a while. A clear break above 1.0830 (R1) is possible to open the way for our next resistance at 1.0900 (R2). Shifting my attention to our momentum oscillators, I see that the RSI emerged above its 50 line, while the MACD, already above its trigger line, is headed towards its zero line. There is also positive divergence between both these indicators and the price action. These indicators detect upside momentum and amplify the case that further retracement could be in the works before the next leg down. In the bigger picture, the break below the key support area of 1.0800 on the 6th of November signaled the downside exit from the sideways range the pair had been trading since the last days of April. In my view, this has turned the longer-term outlook negative and corroborates my view to treat any possible further advances as a corrective move before sellers take the reins again.
• Support: 1.0775 (S1), 1.0700 (S2), 1.0675 (S3)
• Resistance: 1.0830 (R1), 1.0900 (R2), 1.0950 (R3)
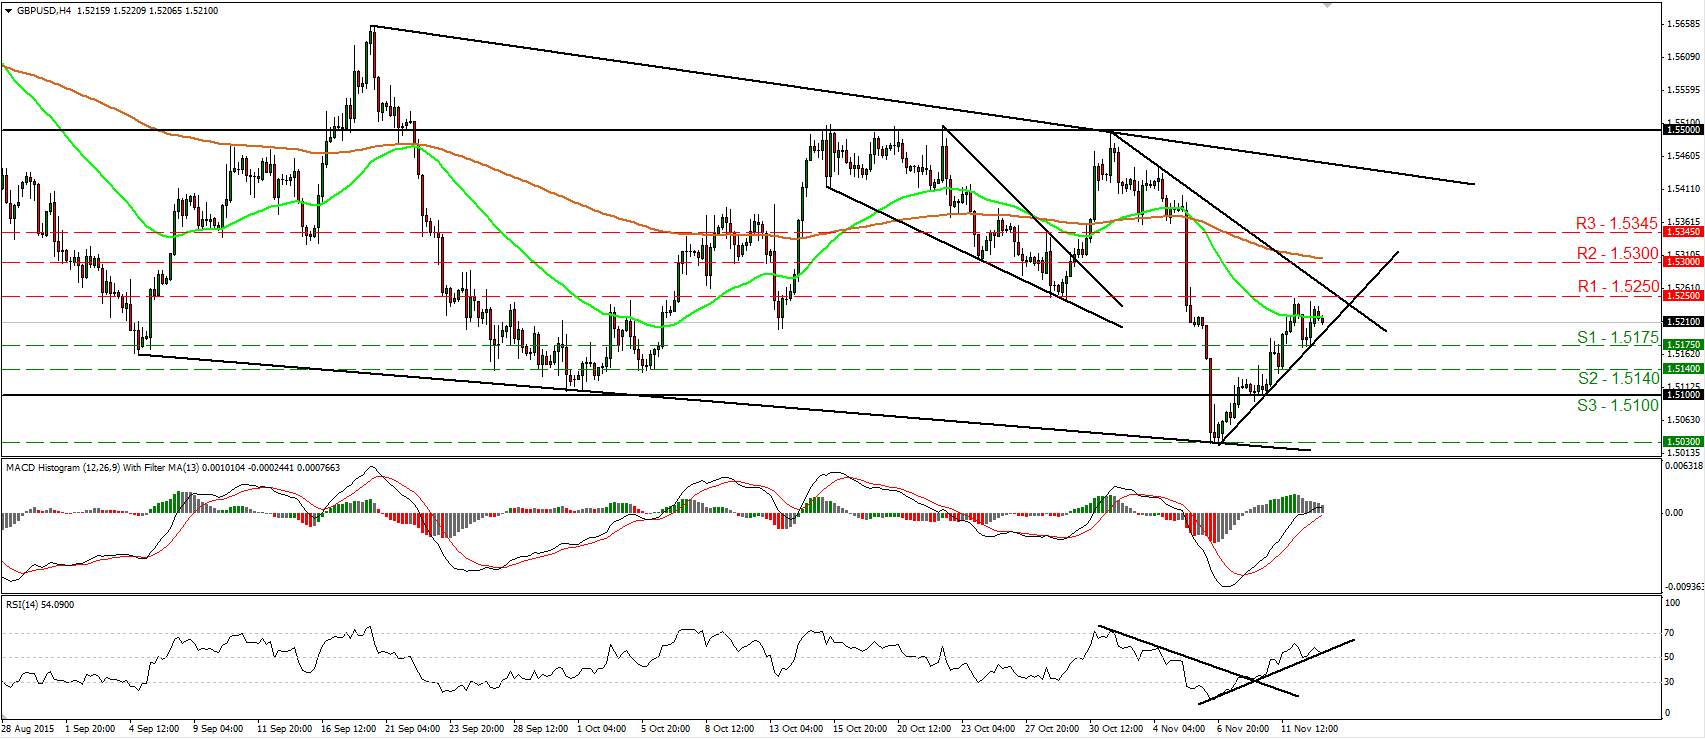
GBP/USD hits again resistance slightly below 1.5250
• GBP/USD traded higher yesterday, but found resistance again marginally below the 1.5250 (R1) line. Although the pair remains above the short-term uptrend line drawn from the low of the 6th of November, I believe that the forthcoming wave is likely to be negative, even below that trend line. A break back below 1.5175 (S1) is could confirm the case and could initially aim for the 1.5140 (S2) hurdle. Our short-term momentum studies support the notion as well. The RSI has turned down and now looks ready to fall below its upside support line, while the MACD shows signs of topping slightly above zero. It could turn negative soon. Switching to the daily chart, I see that the rate is trading well below the 80-day exponential moving average, which has started turning down. Therefore, I would see a cautiously negative longer-term picture and I would treat any positive moves that stay limited below the 80-day EMA as a corrective phase for now.
• Support: 1.5175 (S1), 1.5140 (S2), 1.5100 (S3)
• Resistance: 1.5250 (R1), 1.5300 (R2), 1.5345 (R3)
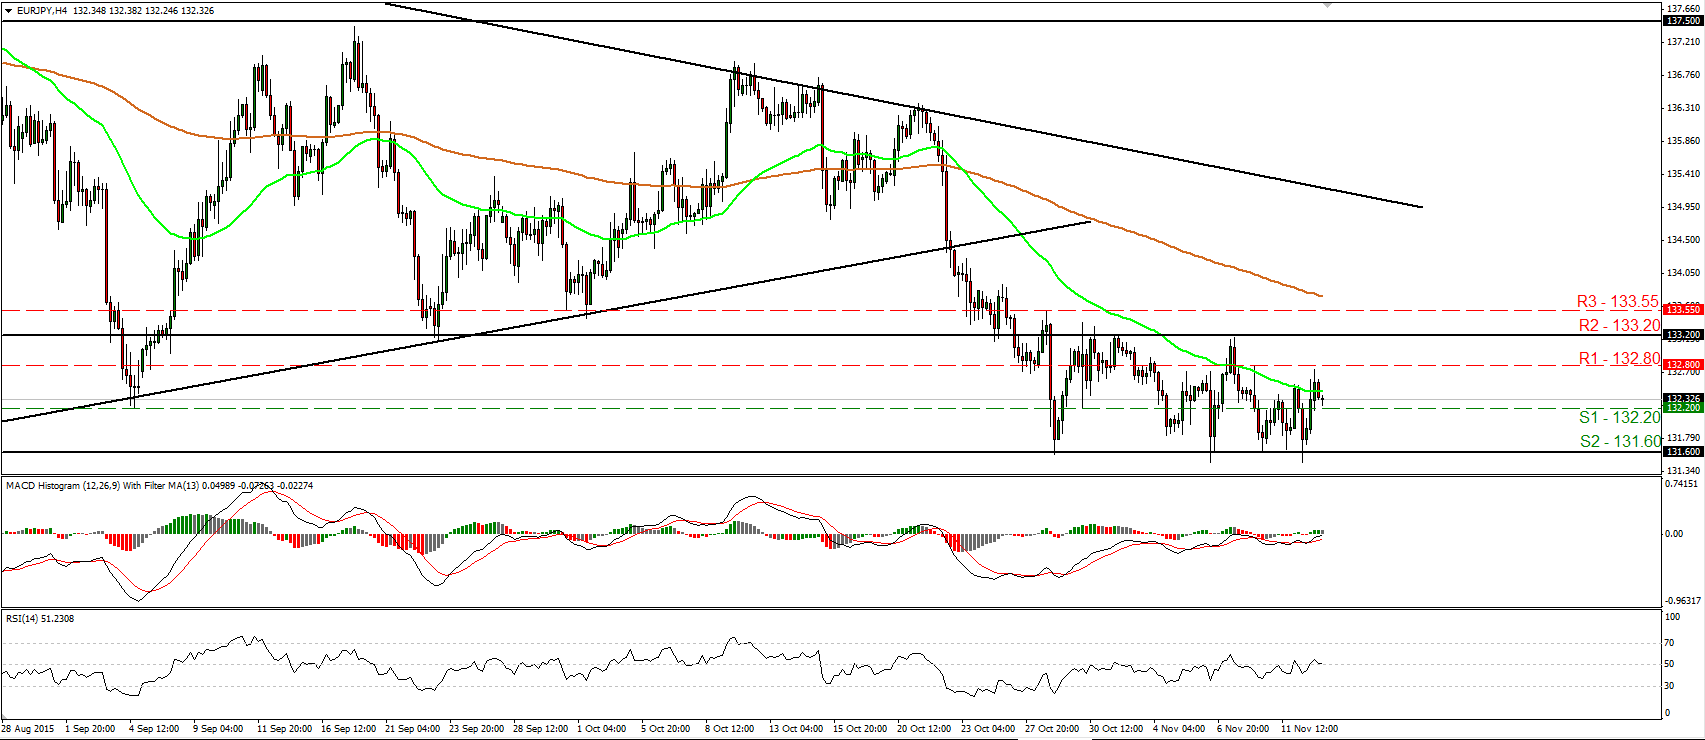
EUR/JPY still in a trendless mode
• EUR/JPY moved higher on Thursday, but hit resistance near 132.80 (R1) and then it retreated. The pair has been trading in a sideways mode since the 28th of October, between 131.60 (S2) and the resistance of 133.20 (R2). As a result, I would consider the short-term picture of this pair to be flat. For now however, given the rebound from the lower bound of the range, I see the likelihood for the rate to continue higher. A break above 132.80 (R1) is likely to reaffirm the case and perhaps target the upper boundary of the aforementioned range, at 133.20 (R2). Both our short-term momentum studies oscillate around their equilibrium lines, supporting the non-trending mode of the pair. As for the broader trend, on the 22nd of October, the rate fell below the upside support line taken from the low of the 14th of April. This has turned the medium-term outlook somewhat negative. However, I prefer to see a clear close below the key support zone of 131.60 (S2) before I get more confident on larger longer-term declines.
• Support: 132.20 (S1), 131.60 (S2), 131.00 (S3)
• Resistance: 132.80 (R1), 133.20 (R2), 133.55 (R3)
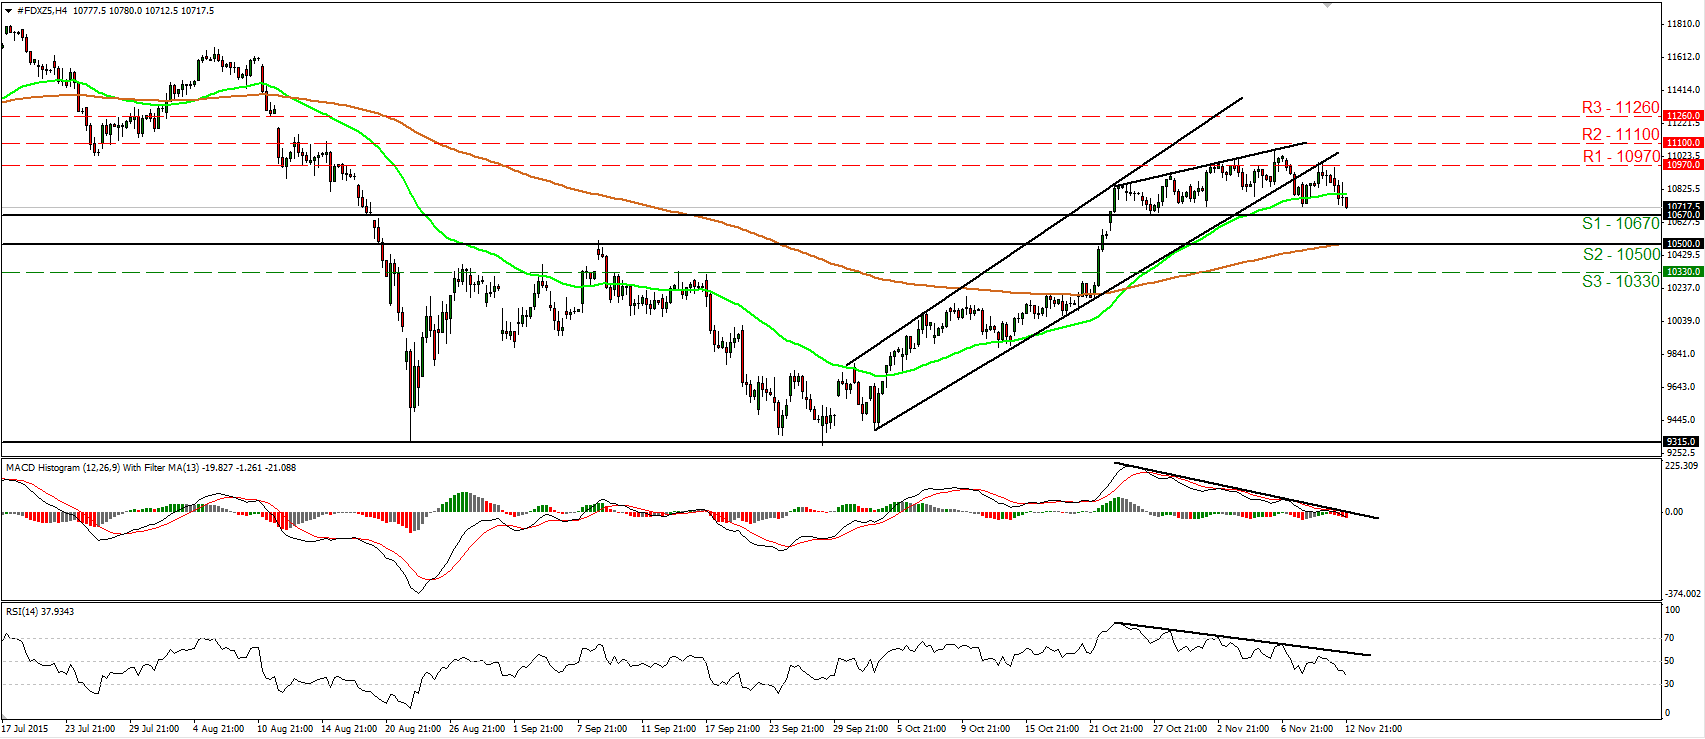
DAX futures are headed towards 10670
• DAX futures found resistance at the prior uptrend line taken from the low of the 2nd of October and then, they traded lower. The index is now headed towards the 10670 (S1) support zone, where a clear dip could prompt extensions towards the psychological zone of 10500 (S2). Yesterday’s decline confirmed the negative divergence between our short-term oscillators and the price action, something that enhances my view that further setback could be on the cards. What is more, both the oscillators detect downside momentum adding to that view. The RSI fell back below its 50 line and now it points south, while the MACD, already below its trigger line, has turned negative. On the daily chart, the break above the psychological zone of 10500 (S2) on the 22nd of October signalled the completion of a double bottom formation. This keeps the medium-term outlook somewhat positive and as a result, I would consider any future short-term declines as a retracement for now.
• Support: 10670 (S1), 10500 (S2), 10330 (S3)
• Resistance: 10970 (R1), 11100 (R2), 11260 (R3)
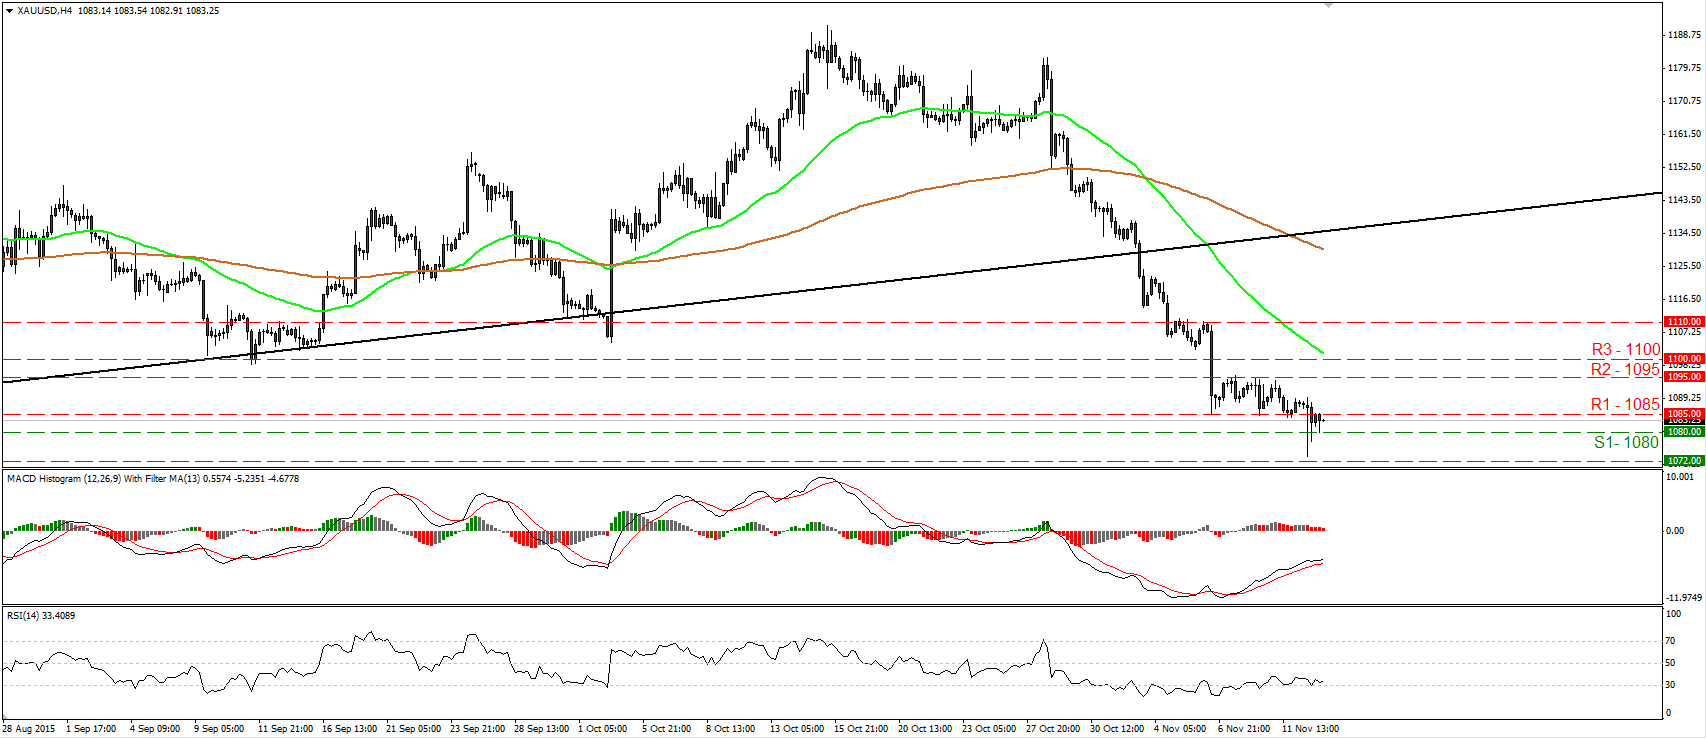
Gold hits support slightly above 1072 and rebounds
• Gold tumbled yesterday, but triggered some buy orders slightly above the 1072 (S2) support line and rebounded to recover almost all of its losses. The metal is now trading between 1080 (S1) and 1085 (R1), and since the picture remains negative in my view, I would expect another dip below 1080 (S1) to open the way for another test near 1072 (S2). Taking a look at our short-term oscillators, I see that the RSI has turned down again and could fall back below its 30 line soon, while the MACD, already negative, shows signs of topping. These momentum sign support somewhat that the yellow metal is likely to continue its short-term downtrend. On the daily chart, the plunge below the upside support line taken from the low of the 20th of July has shifted the medium-term outlook to the downside. As a result, I believe that the metal is poised to trade lower in the foreseeable future.
• Support: 1080(S1), 1072 (S2), 1060 (S3)
• Resistance: 1085 (R1), 1095 (R2), 1100 (R3)

