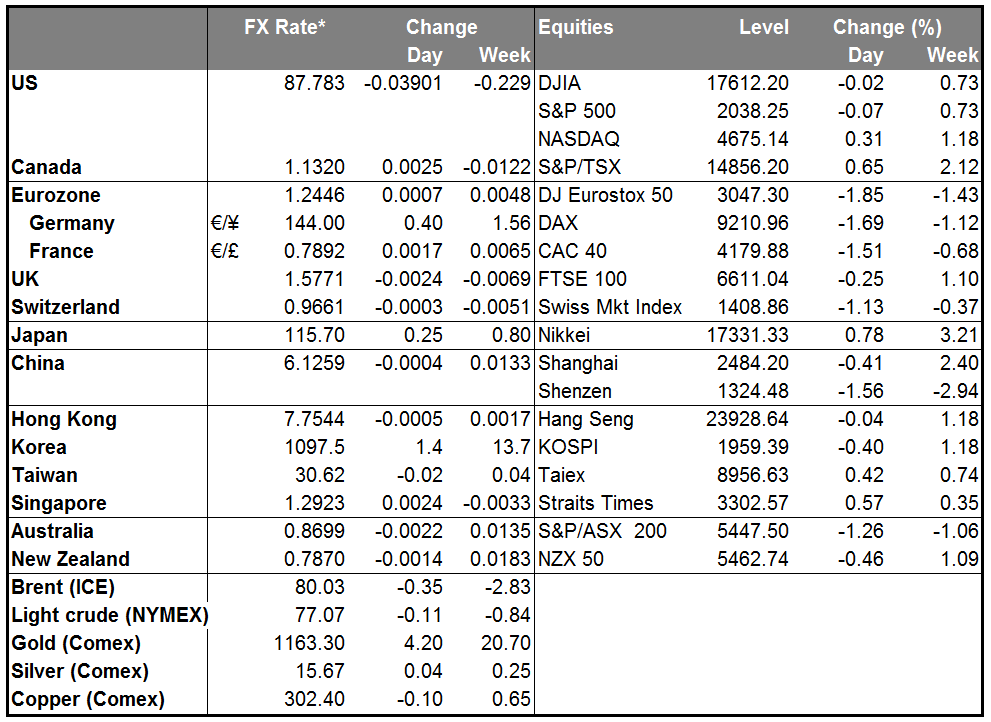
The dollar was mixed in early European trading Thursday. It retained the gains vs GBP that it made following the dovish Bank of England inflation report yesterday, while falling against the commodity currencies, particularly NZD, boosted by a further rise in the manufacturing PMI.
Stepping back from the day-to-day movements, we shouldn’t forget what ECB President Draghi has said: that divergence in monetary policy will be the driving force for currency markets. Let’s look at the overall picture from that respect. The Fed recently ended its quantitative easing and is debating the timing of its first rate hike. By contrast, the Bank of Japan recently increased its “quantitative and qualitative easing” and moreover pledged to continue it indefinitely if necessary. The Bank of England yesterday downgraded its growth and inflation forecasts, causing the market (and us) to push out their forecasts for when the first rate hike would come. And the ECB is just getting its quantitative easing under way. The IMF yesterday warned of downside risks to its growth projections for the euro zone. As the economic picture in Europe deteriorates, even the perennially hawkish Bundesbank President Jens Weidmann seems to be getting on board: in an interview yesterday he made some distinctly dovish comments, such as “the expansionary monetary policy is fundamentally appropriate” and “it is understandable that the ECB's governing council has discussed additional measures…” While he continues to reject the purchase of sovereign bonds, his change in tone over the last few weeks is noticeable: he now views ECB policy as appropriate, whereas just a few months ago he voted against the ABS purchase program; he endorses the increase in the ECB’s balance sheet; and he thinks it’s appropriate to discuss even more measures. This shows a big change in view by the ECB Council’s most hawkish member. Thus the US monetary outlook is almost unique within the G10 (NZD is the only exception) and should support USD going forward, in my view.
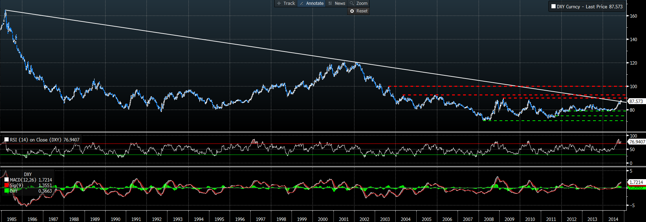
The good fundamentals for the dollar are matched by good technical as well. The US currency recently managed a major technical achievement: last week the DXY index broke above the 30-year downward trendline taken from the highs of March 1985. Technical analysts are waiting to see whether it can close above that trendline this week, somewhere over 87.0 (this morning’s level: 87.81). If so, that could signal the start of a long-term uptrend in the US currency. A move above the psychological zone of 90.00 could reaffirm the break out and perhaps trigger extensions towards the next resistance of 93.00, which happens to coincide with the 23.6% retracement level of the March 1985 – November move. A move above 93.00 would make us truly confident that the major-term downtrend has come to an end. The oscillators signal accelerating bullish momentum: the 14-week RSI, already within its overbought field, found support at its 70 line and bounced back up, while the weekly MACD stands above both its zero and signal lines, pointing up. In my view these oscillators increase the likelihood of the index continuing higher. Hence both the fundamentals and technical are lined up for a stronger dollar.
The only thing that worries me is positioning. The recent Commitment of Traders report showed that speculative long positions in USD have reached a record high, with positioning in several currencies, including EUR, at or near the most net short that they’ve been in the last five years. This may slow the US currency’s rise but shouldn’t prevent it.
Today’s indicators: During the Asian day, China announced that retail sales came in line with expectations while industrial production was a bit below. The news had little impact on AUD, which in any event fell suddenly after RBA Assistant Gov. Kent said the currency is too high relative to fundamentals and the RBA hasn’t ruled out FX intervention. In Japan, machinery orders for September rose on a mom basis instead of falling as expected, but that caused only a momentary dip in USD/JPY. I calculate from looking at various purchasing power parity calculations for USD/JPY that ¥130 is achievable over the medium term.
During the European and US days there is only secondary data out. German final CPI for October will be released; as usual, the forecast is the same as the initial estimate. French CPI for the same month is also coming out.
In the US, the Job Opening and Labor Turnover Survey (JOLTS) report for September is forecast to show the number of job openings decreasing marginally. Initial jobless claims for the week ended Nov. 8 are also due out.
On the other hand, there are a considerable number of central bankers speaking who will probably be the center of the market’s attention. Fed Chair Janet Yellen gives the welcoming remarks at a Fed/ECB event. New York Fed President William Dudley, Philadelphia Fed President Charles Plosser and Minneapolis Fed President Narayana Kocherlakota speak at separate events. Dudley and Kocherlakota are extreme doves, while Plosser is an extreme hawk and they are all voting members, which gives some significance to their speeches. ECB Executive Board member Benoit Coeure also speaks.
The Market
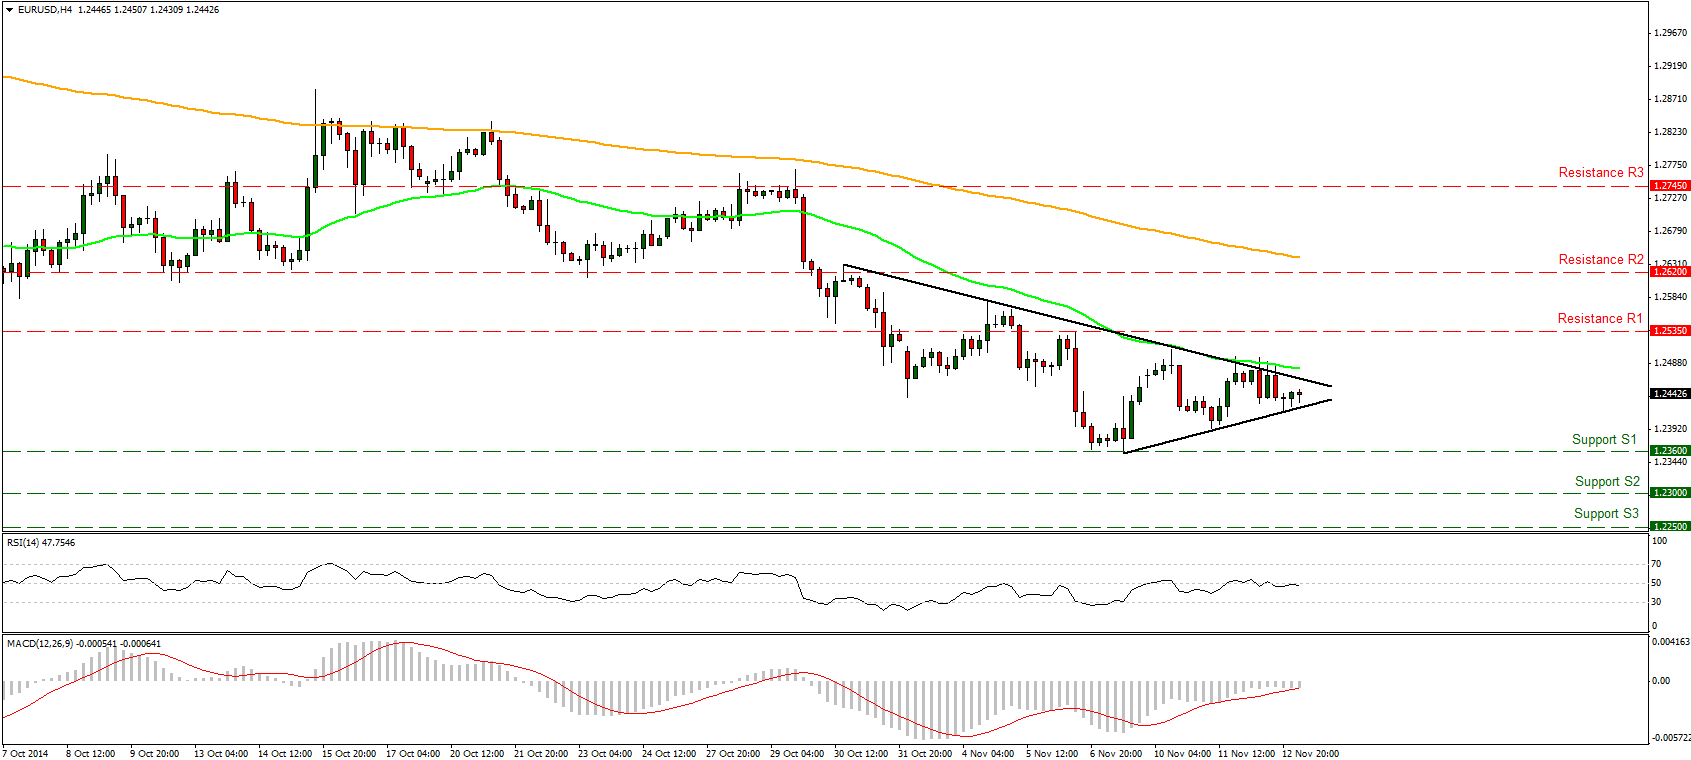
EUR/USD in a symmetrical triangle
EUR/USD remains capped below our black downtrend line and the 50-period moving average. There were a couple of attempts to break the near-term trend line, but none of them found much support and the pair has now formed a symmetrical triangle reflecting investors’ indecisiveness. The Eurozone’s preliminary Q3 GDP figures to be released on Friday could trigger the breakout and set the direction of the pair. Usually the symmetrical triangles are thought of as a continuation pattern. Given the negative outlook of EUR/USD in the bigger picture, this put more chances of a downward breakout, in my view.
• Support: 1.2360 (S1), 1.2300 (S2), 1.2250 (S3).
• Resistance: 1.2535 (R1), 1.2620 (R2), 1.2745 (R3) .
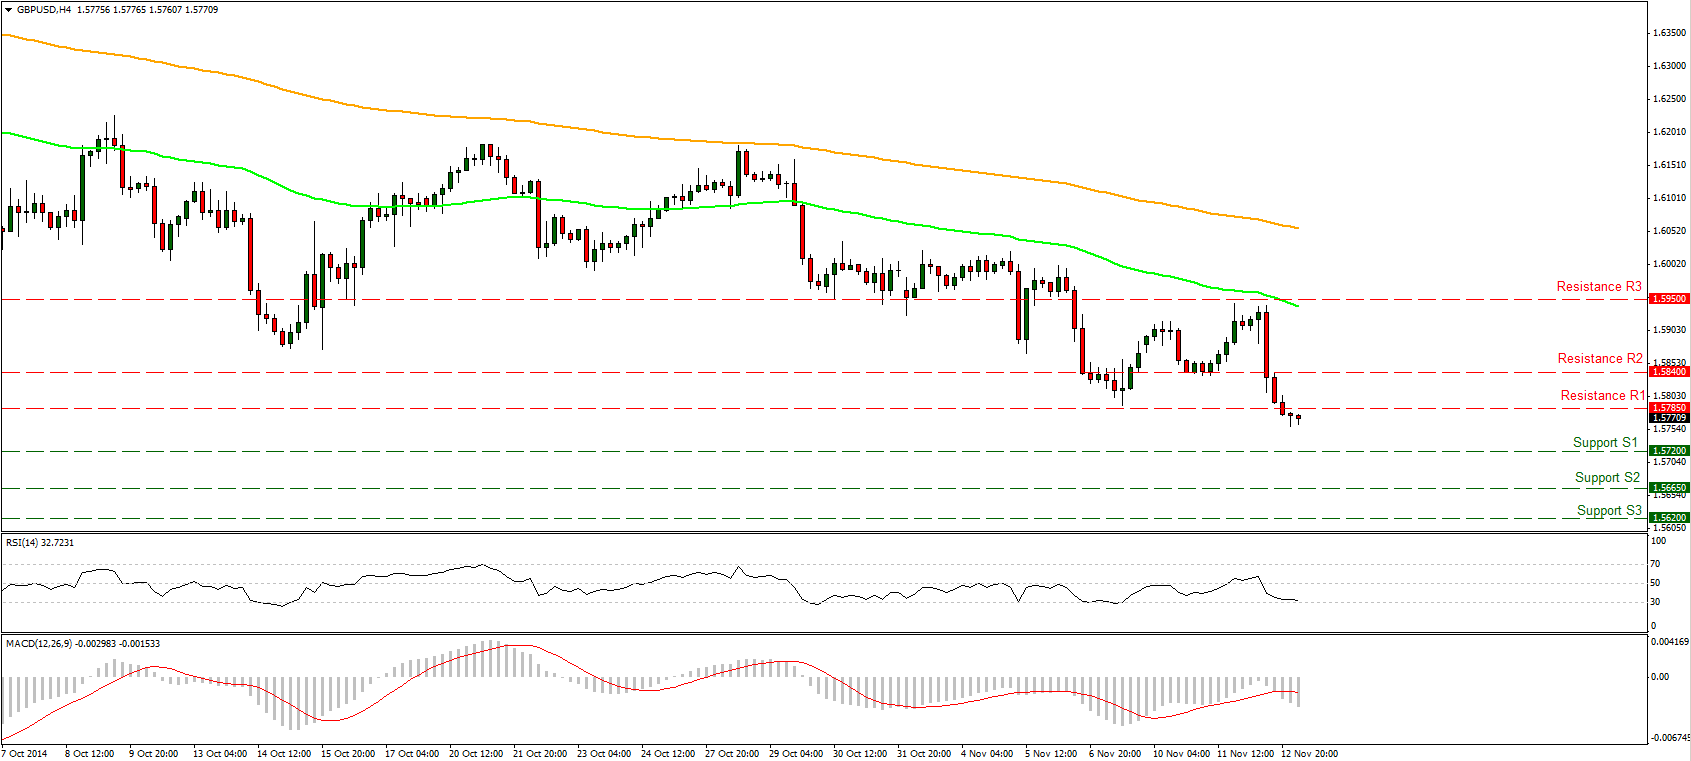
GBP/USD plunged after the inflation report
GBP/USD plunged following the inflation report, breaking our support-turned-into-resistance 1.5785 (R1) line. A dip below that hurdle signaled a forthcoming lower low on the daily chart and could trigger extensions towards the next support barrier of 1.5720 (S1), defined by the high of the 21st of August 2013. Our momentum signs support this notion: the RSI moved towards its 30 line and is pointing down, while the MACD, already in its negative territory, crossed below its trigger line. In the bigger picture, I maintain my view that as long as the pair is trading below the 80-day exponential moving average, the overall path remains negative.
• Support: 1.5720 (S1), 1.5665 (S2), 1.5620 (S3) .
• Resistance: 1.5785 (R1), 1.5840 (R2), 1.5950 (R3).
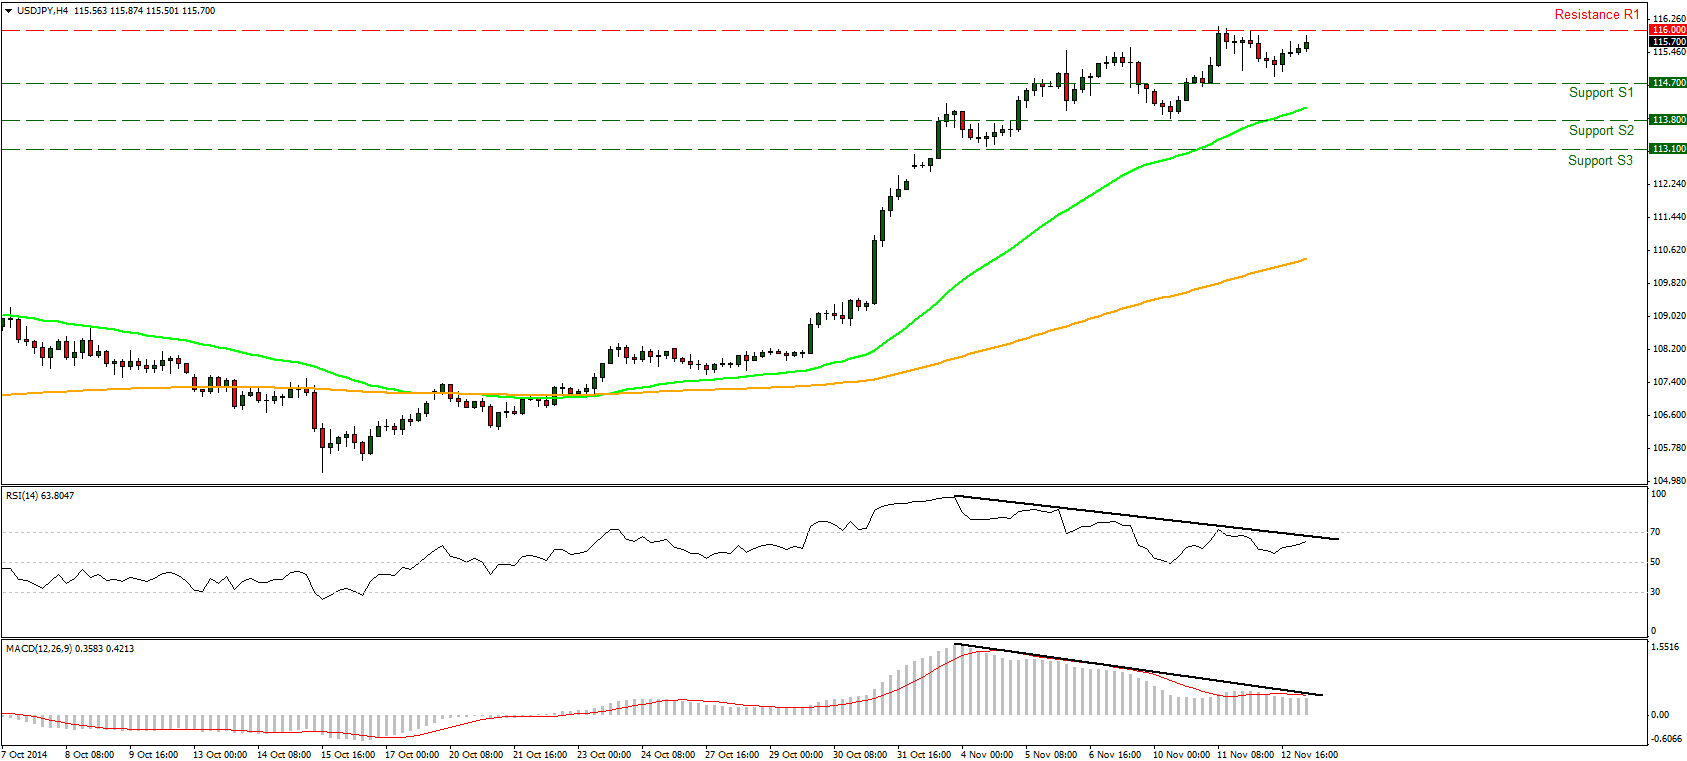
USD/JPY in a consolidative mode
USD/JPY moved sideways on Wednesday, staying below the 116.00 (R1) resistance line. I still see negative divergence between both of our near-term momentum studies and the price action, thus I would stay mindful of a possible pullback in the immediate future, before the bulls prevail again. The pullback could occur at least towards the 114.70 (S1) support line, which stands slightly above the 23.6% retracement level of the 29th of October – 11th of November advance. As for the broader trend, I believe that the overall outlook remains positive and I would treat any possible pullback as a corrective move before buyers prevail again. Furthermore, the daily MACD is already above its zero and trigger line and shows no signs of topping, while the 14-day RSI remains in its overbought territory. These are bullish momentum signs that suggest the rally is likely to continue.
• Support: 114.70 (S1), 113.80 (S2) 113.10 (S3).
• Resistance: 116.00 (R1), 117.00 (R2), 118.00 (R3).
Gold remains elevated near 1167
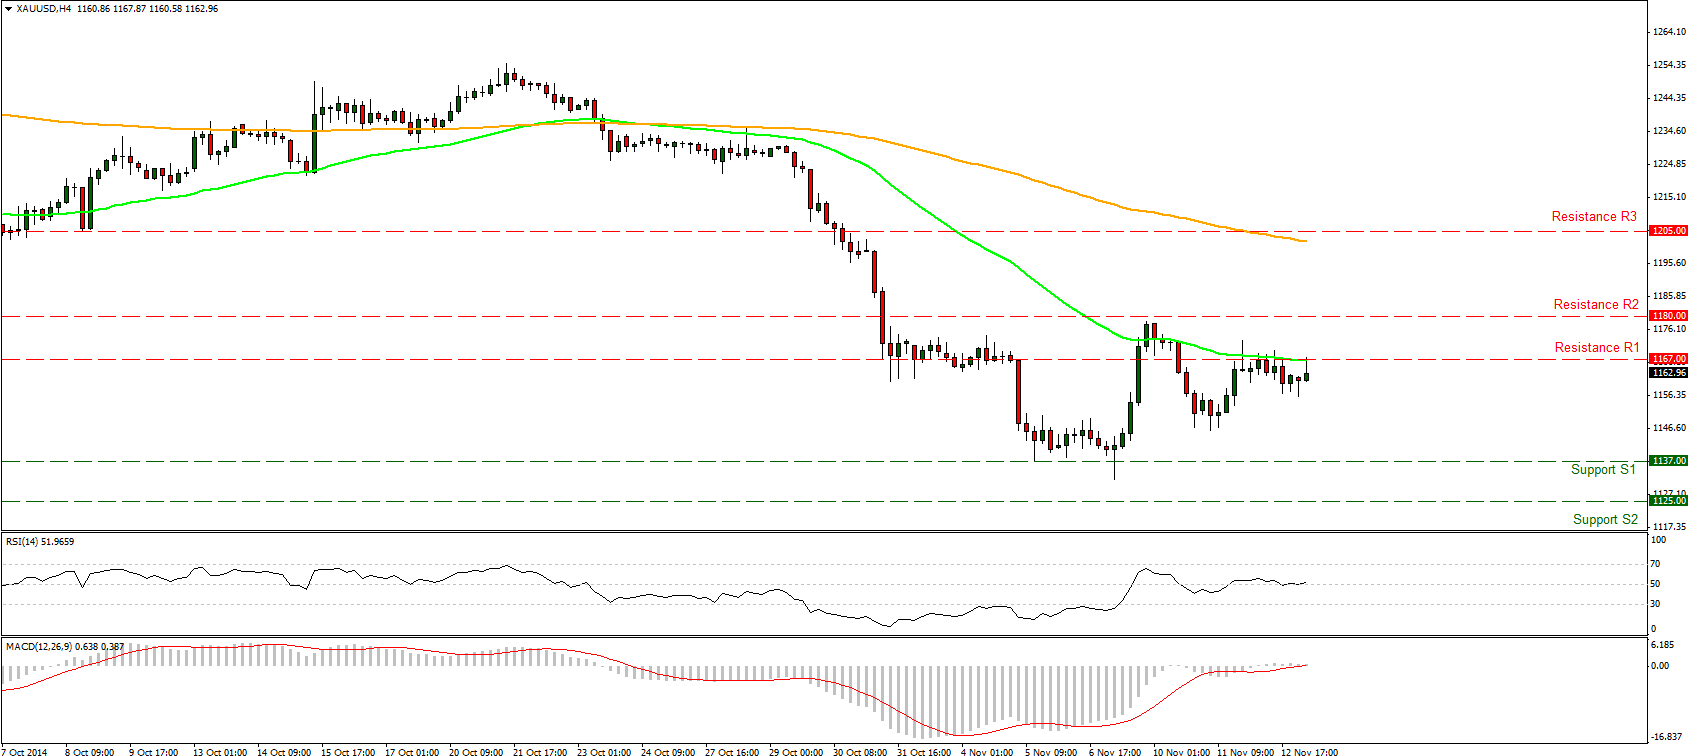
Gold made another attempt on Wednesday to breach our resistance line of 1167 (R1), but once again it proved unsuccessful. During the early European hours, the precious metal is heading for another test of that barrier. As long as this resistance persists, I would prefer to stay on the sidelines at least for the near-term. The RSI is marginally above its 50 line and is pointing up, while the MACD poked its nose above its zero and signal line keeping alive the scenario for another test of the 1167 (R1) hurdle. On the daily chart, the price structure still suggests a downtrend but I will retain my view that a break below the 1137 (S1) zone is needed to get more confident for further extensions.
• Support: 1137 (S1), 1125 (S2), 1100 (S3) .
• Resistance: 1167 (R1), 1180 (R2), 1205 (R3).
WTI still moves sideways
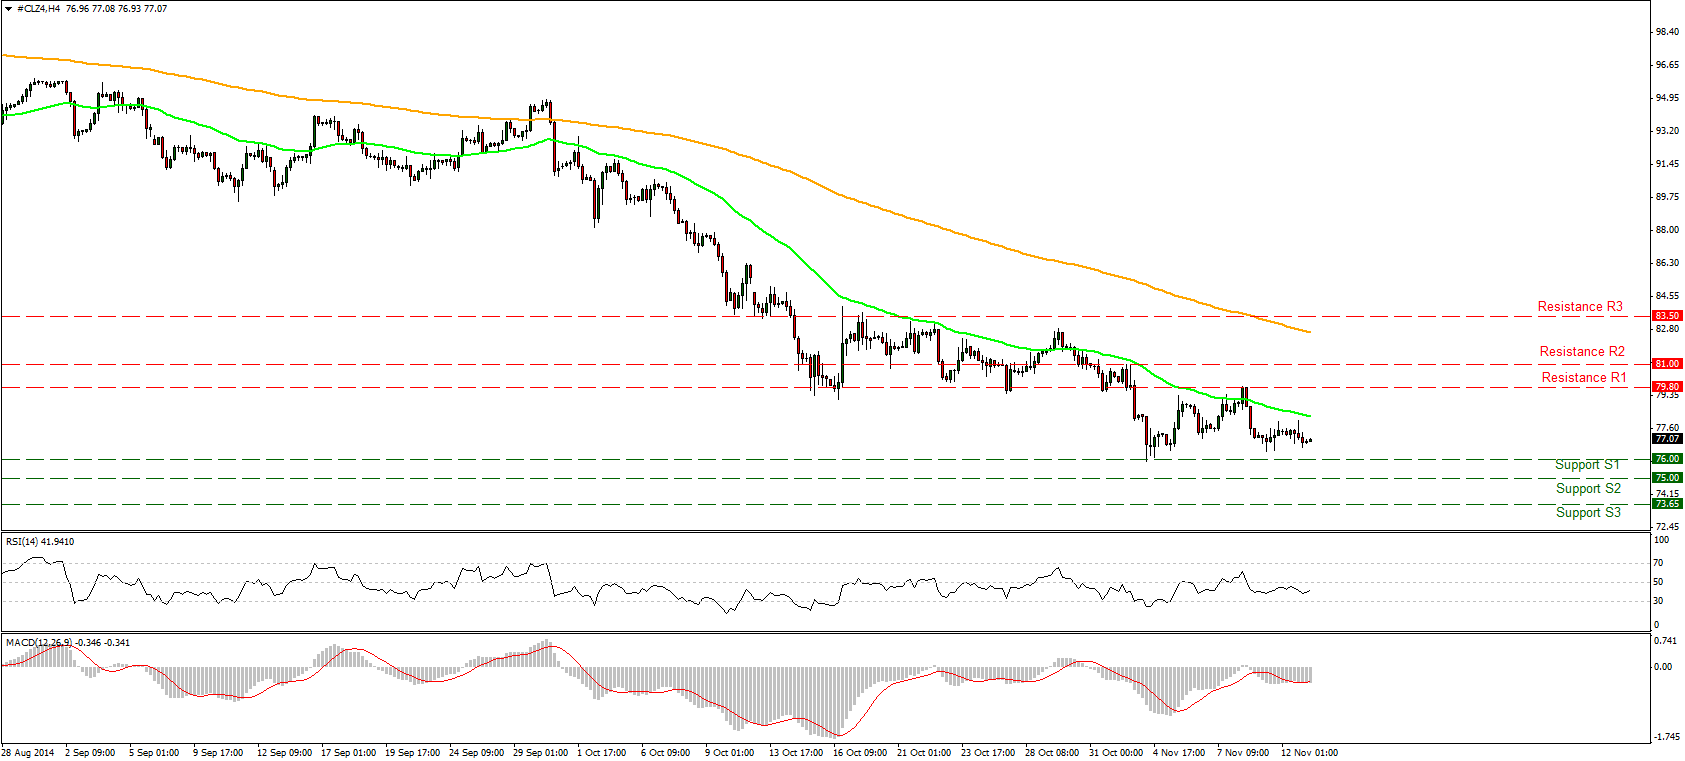
WTI traded sideways between the 76.00 (S1) support area and the resistance of 79.80 (R1). Since the oil price seems to be oscillating between these two lines, I would prefer remain neutral. A clear and decisive break of 76.00 (S1) is necessary for further declines, perhaps towards the psychological zone of 75.00 (S2), defined by the lows of October 2010. On the other hand, a break above 79.80 (R1) could trigger further extensions towards 81.00 (R2). On the daily chart, the price structure remains lower highs and lower lows below both the 50- and the 200- day moving averages, keeping the overall trend to the downside.
• Support: 76.00 (S1), 75.00 (S2), 73.65 (S3) .
• Resistance: 79.80 (R1), 81.00 (R2), 83.50 (R3).

