
Is Italy the new Greece? Let’s read out today’s article and find out what does the newest Italian turmoil imply for the gold market.
Nobody Expects The Italian Inquisition
The recent days have been quite tumultuous in Italy. The turmoil started last week when the new government submitted its spending plans to the EU. The ruling coalition set Italy’s budget deficit at 2.4 percent of its GDP. The number is much higher than the current deficit which is set to be 1.5 percent of the GDP. The proposed difference between spending and revenue is also higher than 1.6 percent proposed by the country’s finance minister Giovanni Tria. So the number was above the expectations. Actually, it came as a shock, especially that the International Monetary Fund has projected it to fall to 0.9 per cent in 2019. Well, nobody expected the Italian inquisition.
Is Italy The New Greece?
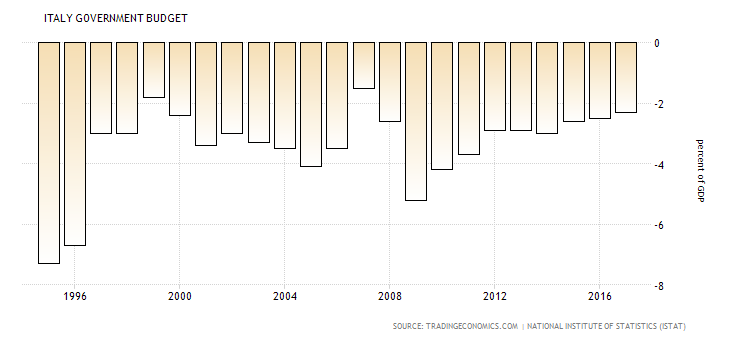
Hence, the markets balked. Investors started to worry that Italy could be the next Greece. These fears are not unfounded, given Italian’s grim fiscal position. As the chart below shows, the country has run a budget deficit consistently over the past 20 years.
Chart 1: Italy’s fiscal deficits (as a % of GDP) since 1995.
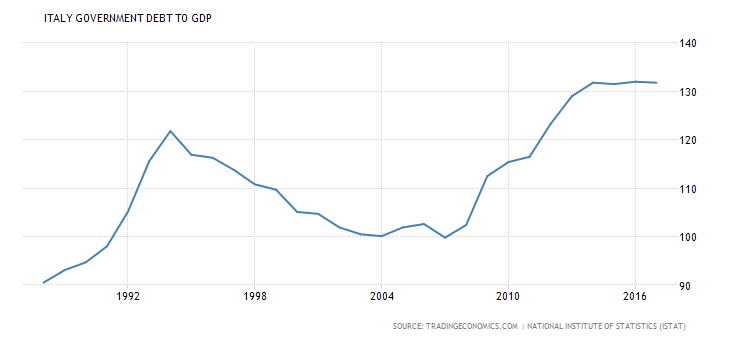
The inevitable consequence of the accumulation of deficits is the sky-high level of public debt in Italy. It already surpasses the country’s annual production being at 130 percent of the GDP. Only a few countries hold higher ratios of debt to GDP (yeah, Greece is within that elite club). And it goes without saying that the increase in budget deficit will not help to reduce that enormous indebtedness.
Chart 2: Italy’s public debt (as % of GDP) since 1988.
Not surprisingly, investors panicked and started to sell Italian bonds. After all, Italy is not the small Greece, but the eurozone’s third-largest economy and the EU’s fourth-largest economy, which accounts for about 11.3 percent of the union’s GDP. Thus, the Italian bond yields surged, as the chart below shows.
Chart 3: Yields on Italy’s 10-year Government Bonds over the last twelve months
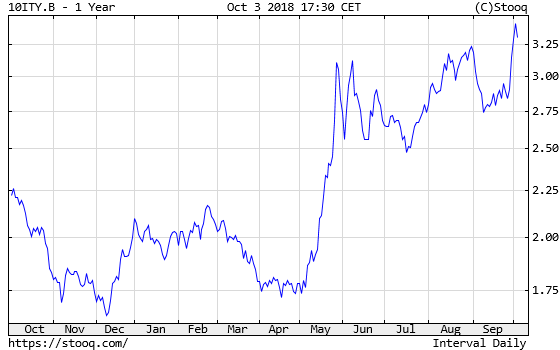
They jumped more than 20% in just over a week, rising above 3.25%, the highest level since 2014. The spread between Italian and German bonds surged above 3 percentage points, while the spread between Italian and Greek bonds, which are seen as not very safe assets, narrowed to the lowest level since 2009.
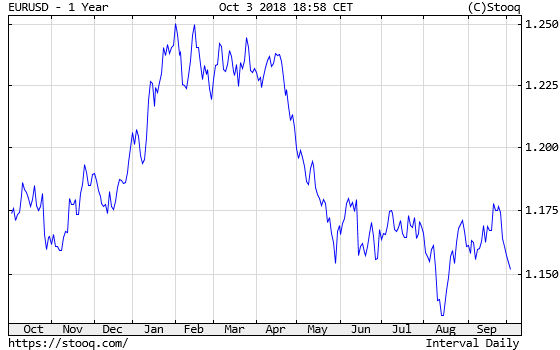
And the euro, which – as a political project – is very sensitive to political risk in European countries – dropped about 2 percent against the US dollar (see the chart below).
Chart 4: EUR/USD exchange rate over the last twelve months
Implications For Gold
What does it all imply for the gold market? Well, the Italy’s irresponsible fiscal policy put the country in breach of the EU rules and risks another crisis in the eurozone, including potentially the breakdown of the common currency area. However, we are not here yet. The Italian tensions have had limited spillovers to other countries so far (just look for instance at the Spanish yields). And the Italian press reported yesterday that the government is planning to lower its deficit in 2020 and 2021. Although the spending plans are still much higher, there is willingness to get along with the Brussels and decrease the deficit in the coming years. The risk sentiment returned after these budget concessions. The Italian yields, the European stocks and the euro rebounded. If this sentiment stays, gold may be under pressure. Indeed, yesterday, the price of gold decreases, as the next chart shows.
Chart 5: Gold prices from October 1 to October 3.
However, Italy remains one of the biggest risks for the Eurozone economy. Investors should remember that the ruling coalition wants to increase social spending (“citizens income” for poor) and lower the retirement age. It will not boost the country’s productivity growth. Hence, Italy, with its massive debt pile, will remain completely unprepared when the next crisis hits. When that happens, gold should shine. But we have to wait a bit for that. Rome wasn’t destroyed in a day.
Disclaimer: Please note that the aim of the above analysis is to discuss the likely long-term impact of the featured phenomenon on the price of gold and this analysis does not indicate (nor does it aim to do so) whether gold is likely to move higher or lower in the short- or medium term. In order to determine the latter, many additional factors need to be considered (i.e. sentiment, chart patterns, cycles, indicators, ratios, self-similar patterns and more) and we are taking them into account (and discussing the short- and medium-term outlook) in our trading alerts.