DM Mfg PMIs And UST 10Y
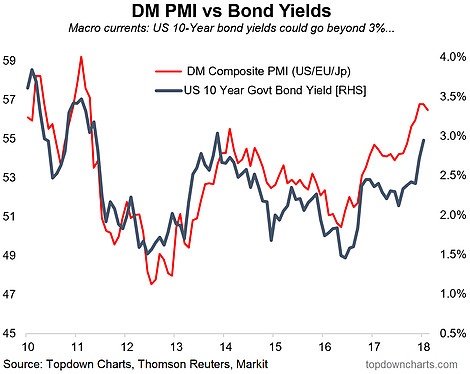
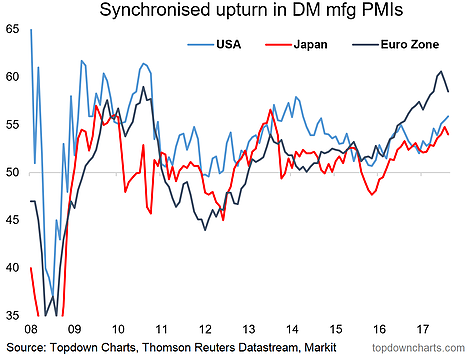
In case you didn't get that, it's Developed Markets manufacturing PMI (Purchasing Managers Index) and US 10-Year government bond yields. That's a reference to chart 1 in today's blog post. Chart 1 shows a composite view of the flash manufacturing PMI (from Markit) for the major developed economies. The reading for February fell to 56.5 from 56.8 in January, the weakness was from the Eurozone (down -1.1 points to a still very strong 58.5) and Japan (down -0.8 pts to a respectable 54.0 which is very good by Japanese standards), while the USA improved (+0.4 pts to 55.9 which places it at a 40 month high).
So overall the composite DM manufacturing PMI did slip a bit, but each of the 3 major economies in this analysis are still running pretty strong numbers. It highlights what we've been saying in terms of the synchronized strength across developed economies, and the steady reduction in spare capacity. It's these forces that help shape a stronger growth/inflation outlook, which naturally has flow-on implications for global monetary policy (2 key themes from the 2018 Outlook) and bond yields, among other things.
The main conclusions on the outlook for developed economies and bond yields are:
-The composite DM PMI fell slightly in Feb, but remains at solid levels.
-The synchronized strength in the PMIs reflects the better growth/inflation outlook and implies possible additional upside to bond yields.
-The US economy remains the wildcard, and if the surge in positive corporate earnings revisions is anything to go by there could be further upside in the US PMI on the cards.
1. Bond Yields vs DM PMI: As noted, the DM composite PMI dipped slightly in the February flash reading (56.5 vs 56.8) and this comes on the back of a flat/no-changed figure in Jan vs Dec. The flask half empty folk will look at this chart and say that DM PMIs are rolling over. I wouldn't be so quick to jump to that conclusion, but it's certainly something to keep an eye on. For now this chart says bond yields go higher, but there will come a time to fade the rise in bond yields – just not quite yet in my view.

2. Major DM Manufacturing PMIs: Looking at the detail behind the composite PMI, you can see how stark the improvement in the Eurozone economy has been, yet also there is a sense of synchronized strength across the 3 major DM economies. Being still the largest economy, what happens with the US is still the key wildcard, and if the strength in earnings revisions is a reflection of things to come on the economic front too, then there could be some interesting upside yet to come even as the global economic cycle slowly matures.

