
A solid investment also delivers solid returns over the time. Dividend growth is not the only criteria for a good investment. There are also many dividend growth stocks with low or negative returns on investments and on equity ratios.
I screened the Dividend Contenders Database by stocks with high return ratios. I fixed the 20 percent level in order to get the best results.
Only 15 companies fulfilled both, a return on equity as well as a return on investment over 20 percent. The difference between those two ratios is that the return on investment does not include the leverage effect. A corporate with high debts will automatically generate high returns on equity. The second ratio is a performance measure that looks only at the investment by dividing the investment return by the costs of the investment.
One High-Yield is below the results and 10 stocks got a buy or better rating by brokerage firms. Leverage is the key for high returns in my screen. As you might see in the attached sheet, the debt ratios are modestly high but in the end, the investor will pay a higher price for a leveraged company.
Intl. Business Machines (IBM) has a market capitalization of $211.84 billion. The company employs 434,246 people, generates revenue of $104.507 billion and has a net income of $16.604 billion. Intl. Business Machines’s earnings before interest, taxes, depreciation and amortization (EBITDA) amounts to $26.556 billion. The EBITDA margin is 25.41 percent (the operating margin is 20.96 percent and the net profit margin 15.89 percent).
Financial Analysis: The total debt represents 27.91 percent of Intl. Business Machines’s assets and the total debt in relation to the equity amounts to 176.40 percent. Due to the financial situation, a return on equity of 85.15 percent was realized by Intl. Business Machines. Twelve trailing months earnings per share reached a value of $14.06. Last fiscal year, Intl. Business Machines paid $3.30 in the form of dividends to shareholders. IBM has a return on equity of 82.4 percent together with a return on investment of 31.9 percent.
Market Valuation: Here are the price ratios of the company: The P/E ratio is 13.75, the P/S ratio is 2.03 and the P/B ratio is finally 11.46. The dividend yield amounts to 1.96 percent and the beta ratio has a value of 0.71. Rollins (ROL) has a market capitalization of $3.81 billion. The company employs 10,470 people, generates revenue of $1.270 billion and has a net income of $111.33 million. Rollins’s earnings before interest, taxes, depreciation and amortization (EBITDA) amounts to $214.84 million. The EBITDA margin is 16.90 percent (the operating margin is 13.90 percent and the net profit margin 8.76 percent).
Financial Analysis: The total debt represents 0.00 percent of Rollins’s assets and the total debt in relation to the equity amounts to 0.00 percent. Due to the financial situation, a return on equity of 32.80 percent was realized by Rollins. Twelve trailing months earnings per share reached a value of $0.78. Last fiscal year, Rollins paid $0.32 in the form of dividends to shareholders. ROL has a return on equity of 31 percent together with a return on investment of 31.40 percent.
Market Valuation: Here are the price ratios of the company: The P/E ratio is 33.37, the P/S ratio is 3.00 and the P/B ratio is finally 10.74. The dividend yield amounts to 1.38 percent and the beta ratio has a value of 0.62.
Polaris Industries (PII) has a market capitalization of $8.72 billion. The company employs 4,500 people, generates revenue of $3.209 billion and has a net income of $312.31 million. Polaris Industries’s earnings before interest, taxes, depreciation and amortization (EBITDA) amounts to $515.21 million. The EBITDA margin is 16.05 percent (the operating margin is 14.91 percent and the net profit margin 9.73 percent).
Financial Analysis: The total debt represents 7.21 percent of Polaris Industries’s assets and the total debt in relation to the equity amounts to 15.52 percent. Due to the financial situation, a return on equity of 52.46 percent was realized by Polaris Industries. Twelve trailing months earnings per share reached a value of $4.77. Last fiscal year, Polaris Industries paid $1.48 in the form of dividends to shareholders. PII has a return on equity of 46.80 percent together with a return on investment of 39.0 percent.
Market Valuation: Here are the price ratios of the company: The P/E ratio is 26.56, the P/S ratio is 2.72 and the P/B ratio is finally 12.59. The dividend yield amounts to 1.33 percent and the beta ratio has a value of 1.78.
Ross Stores (ROST) has a market capitalization of $15.67 billion. The company employs 16,000 people, generates revenue of $9.721 billion and has a net income of $786.76 million. Ross Stores’s earnings before interest, taxes, depreciation and amortization (EBITDA) amounts to $1.457 billion. The EBITDA margin is 14.99 percent (the operating margin is 13.01 percent and the net profit margin 8.09 percent).
Financial Analysis: The total debt represents 4.09 percent of Ross Stores’s assets and the total debt in relation to the equity amounts to 8.49 percent. Due to the financial situation, a return on equity of 48.27 percent was realized by Ross Stores. Twelve trailing months earnings per share reached a value of $3.85. Last fiscal year, Ross Stores paid $0.59 in the form of dividends to shareholders. ROST has a return on equity of 46.4 percent together with a return on investment of 41 percent.
Market Valuation: Here are the price ratios of the company: The P/E ratio is 18.80, the P/S ratio is 1.61 and the P/B ratio is finally 9.04. The dividend yield amounts to 0.94 percent and the beta ratio has a value of 0.73.
Take a closer look at the full list of Dividend Contenders with high returns on equity and returns on investment combined. The average P/E ratio amounts to 21.46 and forward P/E ratio is 17.55. The dividend yield has a value of 2.06 percent. Price to book ratio is 12.05 and price to sales ratio 2.80. The operating margin amounts to 21.93 percent and the beta ratio is 0.96. Stocks from the list have an average debt to equity ratio of 0.96.
Here is the full table with some fundamentals (TTM): 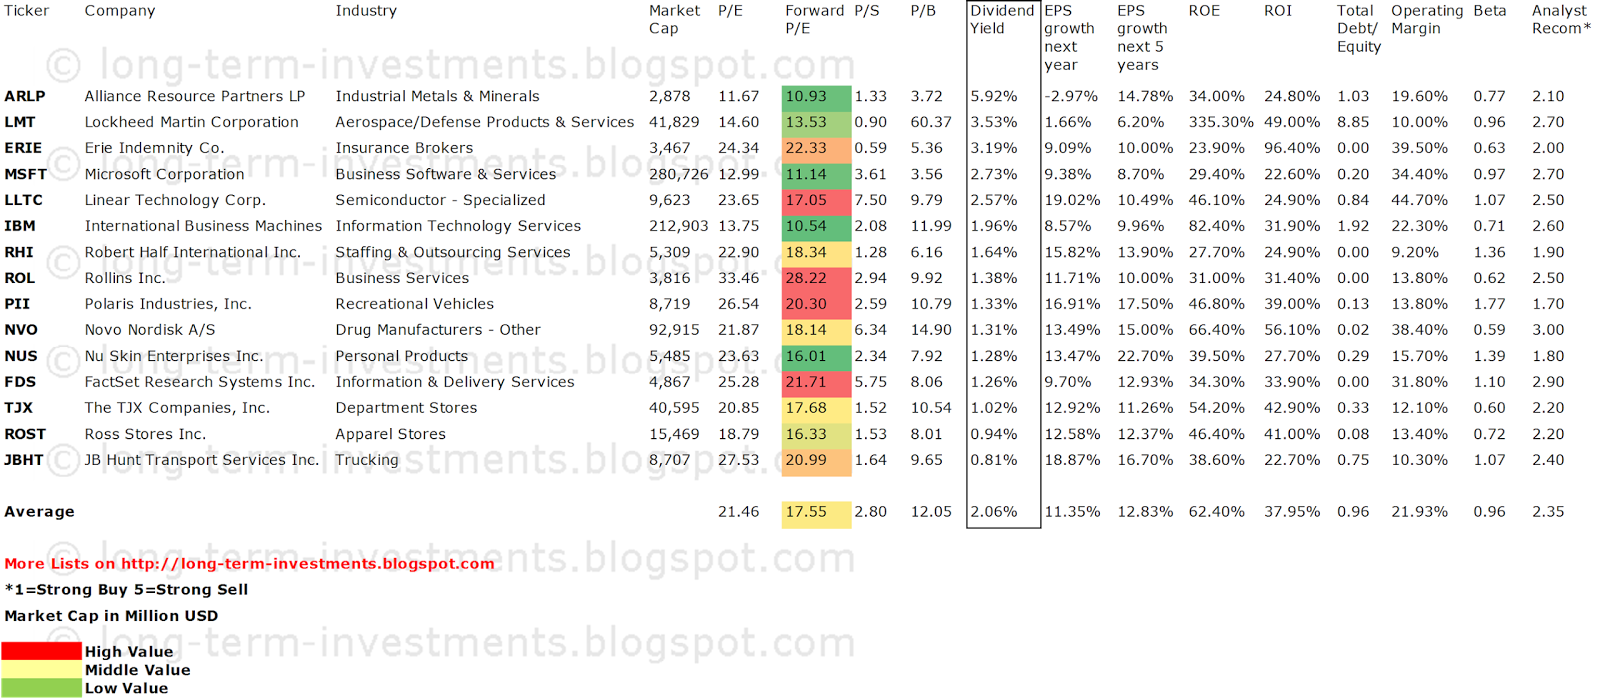
Related Stock Ticker Symbols:
ARLP, LMT, ERIE, MSFT, LLTC, IBM, RHI, ROL, PII, NVO, NUS, FDS, TJX, ROST, JBHT
Disclosure: I am long LMT, IBM, NVO, FDS. I receive no compensation to write about these specific stocks, sector or theme. I don't plan to increase or decrease positions or obligations within the next 72 hours.
For the other stocks: I have no positions in any stocks mentioned, and no plans to initiate any positions within the next 72 hours. I receive no compensation to write about any specific stock, sector or theme.
- English (UK)
- English (India)
- English (Canada)
- English (Australia)
- English (South Africa)
- English (Philippines)
- English (Nigeria)
- Deutsch
- Español (España)
- Español (México)
- Français
- Italiano
- Nederlands
- Português (Portugal)
- Polski
- Português (Brasil)
- Русский
- Türkçe
- العربية
- Ελληνικά
- Svenska
- Suomi
- עברית
- 日本語
- 한국어
- 简体中文
- 繁體中文
- Bahasa Indonesia
- Bahasa Melayu
- ไทย
- Tiếng Việt
- हिंदी
Dividend Contenders With Over 20% Return on Equity
Published 09/20/2013, 03:47 AM
Updated 07/09/2023, 06:31 AM
Dividend Contenders With Over 20% Return on Equity
3rd party Ad. Not an offer or recommendation by Investing.com. See disclosure here or
remove ads
.
Latest comments
Install Our App
Risk Disclosure: Trading in financial instruments and/or cryptocurrencies involves high risks including the risk of losing some, or all, of your investment amount, and may not be suitable for all investors. Prices of cryptocurrencies are extremely volatile and may be affected by external factors such as financial, regulatory or political events. Trading on margin increases the financial risks.
Before deciding to trade in financial instrument or cryptocurrencies you should be fully informed of the risks and costs associated with trading the financial markets, carefully consider your investment objectives, level of experience, and risk appetite, and seek professional advice where needed.
Fusion Media would like to remind you that the data contained in this website is not necessarily real-time nor accurate. The data and prices on the website are not necessarily provided by any market or exchange, but may be provided by market makers, and so prices may not be accurate and may differ from the actual price at any given market, meaning prices are indicative and not appropriate for trading purposes. Fusion Media and any provider of the data contained in this website will not accept liability for any loss or damage as a result of your trading, or your reliance on the information contained within this website.
It is prohibited to use, store, reproduce, display, modify, transmit or distribute the data contained in this website without the explicit prior written permission of Fusion Media and/or the data provider. All intellectual property rights are reserved by the providers and/or the exchange providing the data contained in this website.
Fusion Media may be compensated by the advertisers that appear on the website, based on your interaction with the advertisements or advertisers.
© 2007-2024 - Fusion Media Limited. All Rights Reserved.