LinkedIn (LNKD) reports their earnings after the market closes on Thursday, and there will be a lot of eyeballs on it. With the fall off in Pandora (P), Zynga (ZNGA), and Facebook (FB), this is a lonely survivor among the social media stocks. What to do about it with the earnings catalyst coming up? Let’s take a look.
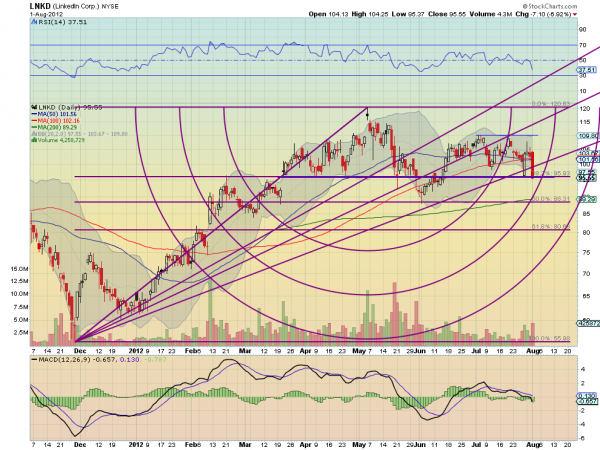
The daily chart below shows that it has spent most of the last 4 months trading between 95.93 and 120.63. This is also between the all time high and the 38.2% retracement of the move from the low to that all time high. Interestingly that 38.2% level at 95.93 was also important support before the top was reached. The one trip below found support near the 50% retracement and quickly moved back higher. The Fibonacci Arcs show the cross of the 50% level at 88.31, support, is happening in the next day or two, just in time for the report, as the price pierces through the 38.2% level.
Also notice that the 200 day SMA is near by. A big confluence. The other indicators, RSI and MACD, both support a move lower, making this area even more significant. On the flip side there has been recent resistance at a double top at 110 and then 115 before that top at 120.63. The technical picture is set. With a downward bias and support at 88.30 and resistance at 110, 115 and 120.63. There is about 5% short interest in this name.
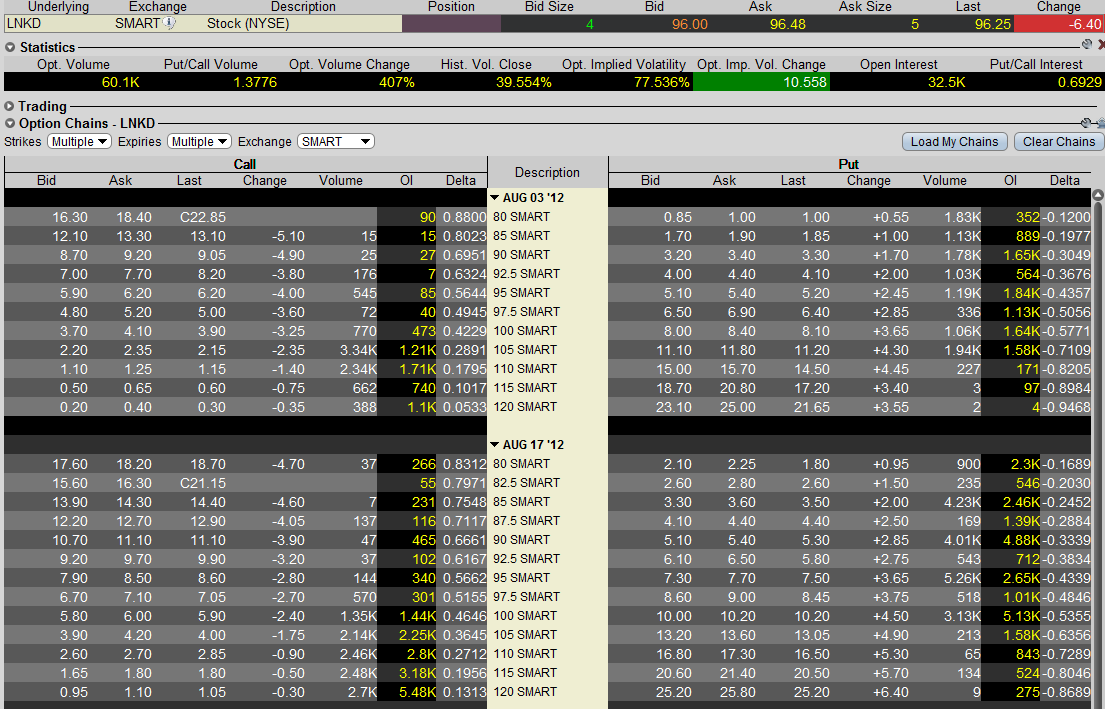
Now focus on the options market. The first thing to look at is the at the market straddles. The weekly straddles last traded at 11.40 on either side of the price. This implies an 11.8% move by Friday based on the last trade and a range of 85 to 107. Normally this would be compared to the average historical move to determine if the options were rich or cheap, but with LinkedIn having little history this is not possible. Next the Implied Volatility (IV) in that weekly option is around 200%. That is a high number and not unusual given the short time left until expiry and the earnings event, but how high is it?
The historical volatility is listed at about 40% and more importantly for our trade design, the IV in the August Monthly options is about 95% while the September IV is around 65%. This tells us that after the earnings event that IV on the weekly option may fall to 95% like the monthly quickly, and that the August options IV may move toward the 65% at September. With the large difference in IV from the weekly options to the Monthly options there is a possibility of a volatility trade. 
Putting these pieces together will result in a trade idea. With a downward bias and support at 88.30 one thought is to participate in that move lower. Buying the weekly 95 Puts at $5.40 is expensive if you are wrong, and to give yourself more time to be right with the August Monthly, 95 Puts costs even more at $7.70. Selling the downside 87.5 or 85 Strike Put can cut that cost by 30-50%. That is a start but you are still out several dollars if you are wrong and the stock moves higher.
Using those higher resistance levels and selling a Call Spread can fix some of that. The August 115/120 Monthly Call Spread can get back another 95 cents. This would open up some risk, and require that you hedge the trade on a move over 115 by buying the stock. But 115 is 20% away in a market that has heavy sentiment especially for social media. Even if it goes higher you will likely have time to hedge. So the first option comes out:
Trade Idea 1: Buy the August 95/87.5 Monthly Put Spread selling the August 115/120 Call Spread for $2.65.
Looking at the volatility angle next shows that a Put Calendar might be beneficial. Selling the August weekly 85 Put for $1.70 and buying the August Monthly 85 Put for $3.60 is a net debit of $1.90. The weekly Put will move towards the intrinsic value quickly after the report, but the the monthly will retain a couple of weeks of time value. So if the price drops to 85 the weekly will move close to zero while the monthly will be worth several dollars. Selling that upside call spread improves the cost by nearly 50% on this trade:
Trade Idea 2: Buy the August Weekly/August Monthly 85 Put Calendar and sell the August Monthly 115/120 Call Spread for 95 cents.
In both trades the plan is to buy back the Call Spread, "the risk," if it moves in your favor, at a reasonable level. A quarter sounds good. Unwind the Put Spread as the stock hits its lows or starts to move higher. If you get 75% of the maximum from the spread immediately it is wise to take it off, rather than risking that 75% to make 255 over the next two weeks. The goal on the Put Calendar would be to have the weekly Put expire worthless and sell the monthly Put for several dollars. If the stock gaps down well below the strike you will be best served selling the Calendar for around what the trade cost, as both options will move towards a 100 delta.
This is a bit,not the full thought process that goes into planning options trades for earnings events. If you want to learn more you know where to find me.
Disclosure: The information in this blog post represents my own opinions and does not contain a recommendation for any particular security or investment. I or my affiliates may hold positions or other interests in securities mentioned in the Blog, please see my Disclaimer page for my full disclaimer.
Original post
- English (UK)
- English (India)
- English (Canada)
- English (Australia)
- English (South Africa)
- English (Philippines)
- English (Nigeria)
- Deutsch
- Español (España)
- Español (México)
- Français
- Italiano
- Nederlands
- Português (Portugal)
- Polski
- Português (Brasil)
- Русский
- Türkçe
- العربية
- Ελληνικά
- Svenska
- Suomi
- עברית
- 日本語
- 한국어
- 简体中文
- 繁體中文
- Bahasa Indonesia
- Bahasa Melayu
- ไทย
- Tiếng Việt
- हिंदी
Developing A LinkedIn Earnings Trade – Long Form
Published 08/02/2012, 03:54 AM
Updated 05/14/2017, 06:45 AM
Developing A LinkedIn Earnings Trade – Long Form
3rd party Ad. Not an offer or recommendation by Investing.com. See disclosure here or
remove ads
.
Latest comments
Install Our App
Risk Disclosure: Trading in financial instruments and/or cryptocurrencies involves high risks including the risk of losing some, or all, of your investment amount, and may not be suitable for all investors. Prices of cryptocurrencies are extremely volatile and may be affected by external factors such as financial, regulatory or political events. Trading on margin increases the financial risks.
Before deciding to trade in financial instrument or cryptocurrencies you should be fully informed of the risks and costs associated with trading the financial markets, carefully consider your investment objectives, level of experience, and risk appetite, and seek professional advice where needed.
Fusion Media would like to remind you that the data contained in this website is not necessarily real-time nor accurate. The data and prices on the website are not necessarily provided by any market or exchange, but may be provided by market makers, and so prices may not be accurate and may differ from the actual price at any given market, meaning prices are indicative and not appropriate for trading purposes. Fusion Media and any provider of the data contained in this website will not accept liability for any loss or damage as a result of your trading, or your reliance on the information contained within this website.
It is prohibited to use, store, reproduce, display, modify, transmit or distribute the data contained in this website without the explicit prior written permission of Fusion Media and/or the data provider. All intellectual property rights are reserved by the providers and/or the exchange providing the data contained in this website.
Fusion Media may be compensated by the advertisers that appear on the website, based on your interaction with the advertisements or advertisers.
© 2007-2024 - Fusion Media Limited. All Rights Reserved.
