It’s been nearly a decade since the nadir of the global financial crisis. Courtesy of a broad-based upswing for most of the years since, the big picture for picking up assets on the cheap is one of scarcity. In relative terms, bargains can be found, of course. Comparing stocks in emerging markets to US equities, for example, is a study in contrasts on a year-to-date basis, based on a set of exchange-traded funds: Vanguard Total Stock Market (NYSE:VTI), a US proxy, is up 8.3% so far in 2018 through August 20 vs. an 8.8% slide in Vanguard FTSE Emerging Markets (NYSE:VWO). But finding value in something approximating clear and ambiguous absolute terms beyond recent history is a tougher challenge.
Definitions matter, of course, when it comes to looking for value, aka, assets that are priced inexpensively compared to some historical benchmark — a state of affairs that implies relatively juicy expected returns. There are many ways to measure value, but as an initial screen across asset classes and its subsets there’s a case to begin the process with five-year annualized return (1,260 trading days), which is inspired by “Value and Momentum Everywhere,” a 2013 Journal of Finance paper by AQR Capital Management’s Cliff Asness and two co-authors.
Five-year performance is hardly the last word on value, but it’s a simple way to begin when sorting through a broad and diverse mix of securities. Indeed, this tool offers the advantage of delivering an apples-to-apples comparison on assets with no obvious accounting-based valuation methodology – think commodities — or securities where data may be scarce — emerging markets bonds, for instance.
The pool of assets for this exercise: 135 exchange-traded products covering the gamut: US and foreign stocks, bonds and real estate, along with funds targeting commodities and currencies. (You can find the full list here, sorted in descending order by five-year return through yesterday, August 20). Note that the full playing field becomes quite granular in spots. In equities, for instance, the ETF list ranges from broad regional definitions (Asia, Latin America, etc,) to country funds and down into US sectors (energy, financials, for instance) and industries (e.g., oil & gas equipment & services). The only limitation is what’s available for US exchange-listed funds. Otherwise, the search is broad and deep.
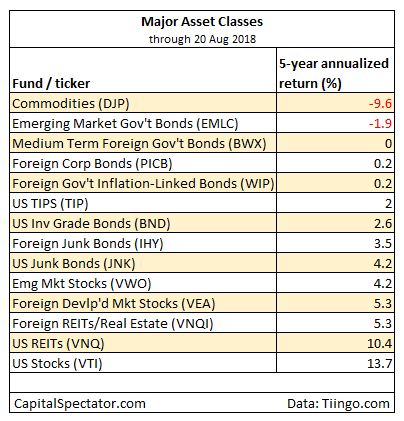
The main takeaway after hauling in the fishing net: deep losses over the trailing five-year window (i.e., deeply discounted asset prices) are in short supply. For some perspective, let’s start with a top-down view via the major asset classes. As the table below shows, red ink is limited to broadly defined commodities and bonds in emerging markets (in US dollar terms). Otherwise, the rest of the field is posting gains. The implication: deep-value pricing is rare on an asset class level, limited primarily to commodities. Emerging-markets bonds appear discounted, too, but only slightly.

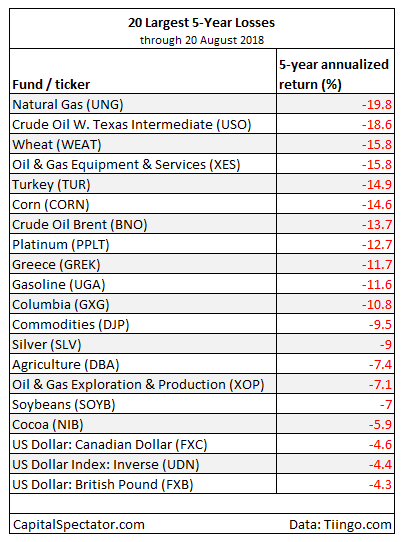
Let’s turn to the deepest five-year losses for the full list of tickers, as shown in the next table below via the top-20 declines. Here, too, commodities dominate the steepest setbacks, starting with natural gas: United States Natural Gas (NYSE:UNG) is nursing a nearly 20% annualized loss for the trailing five-year window. The biggest setback in equities is currently found in iShares MSCI Turkey (NASDAQ:TUR), which is off roughly 15% in annualized terms over the past five years. For US equities, the only fund on the top-20 list is SPDR S&P Oil & Gas Exploration & Production (NYSE:XOP), which has shed a bit more than 7% a year.

Bottom fishing, it seems, is a rough business these days, at least if you’re poring over the battered and bruised corners of the ETF landscape.
