🔮 Better than the Oracle? Our Fair Value found this +42% bagger 5 months before Buffett bought itRead More

XLU And IYR Present Buy Opportunities!

Published 02/11/2018, 12:52 AM
Updated 07/09/2023, 06:31 AM
US500
-
IYR
-
US10YT=X
-
XLU
-

Market declines and under performance can create opportunities. The table below looks at performance of the S&P 500 sectors over the past 90-days. As you can see the S&P has pretty much gone nowhere, yet two different sectors have been hit hard!
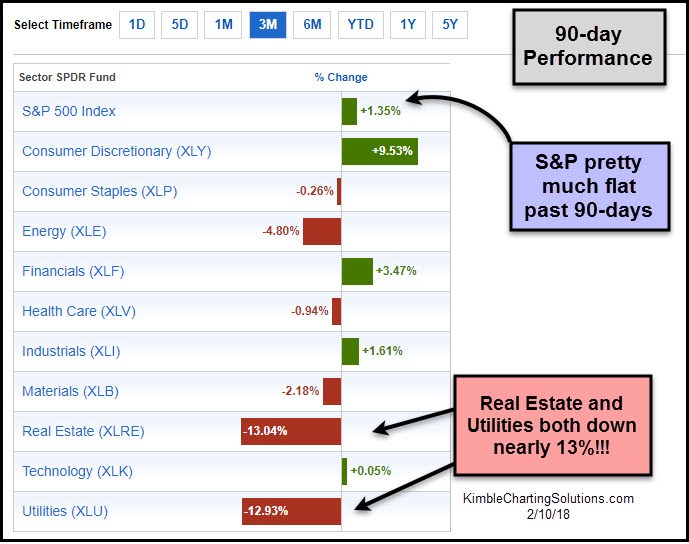
90 Day Performance

Not only has Real Estate and Utilities done poorly the past 90-days, they have under performed the S&P 500 for years!!! Below looks at relative performance of each compared to the S&P 500 since 2000.
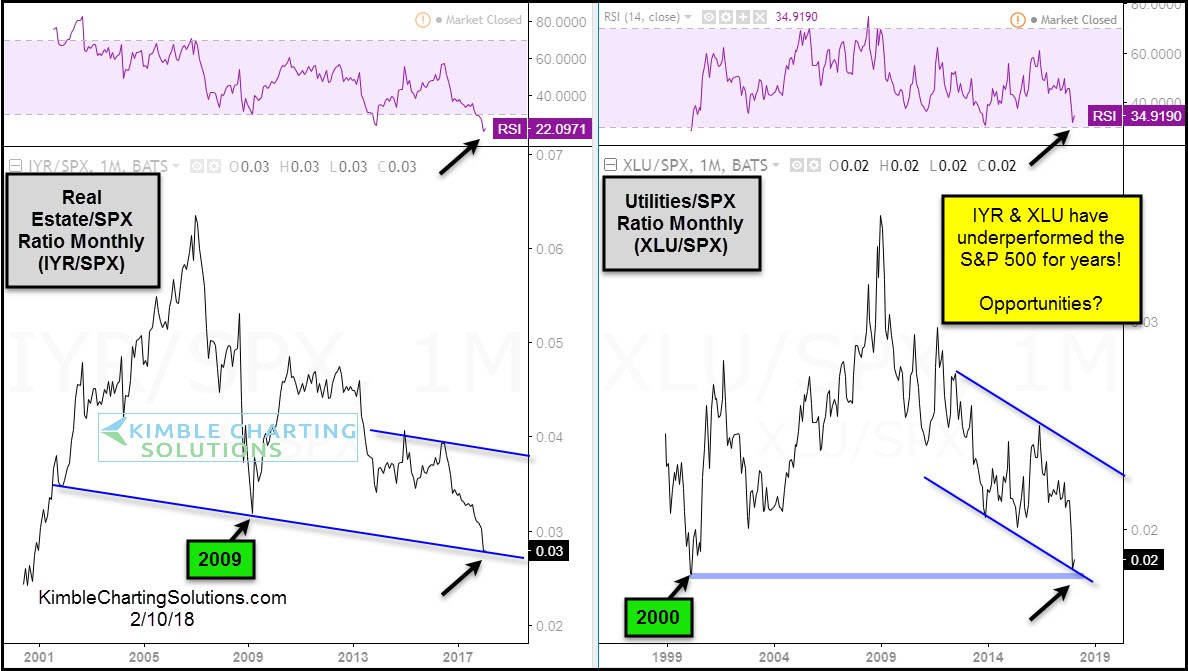
Real Estate SPX Ratio Monthly

The above charts reflect that it has “paid to avoid” these sectors on a relative performance basis. The question to ask yourself is this: Could the years of relative under performance turn into opportunities? These assets are testing potential support, and momentum is deeply oversold.

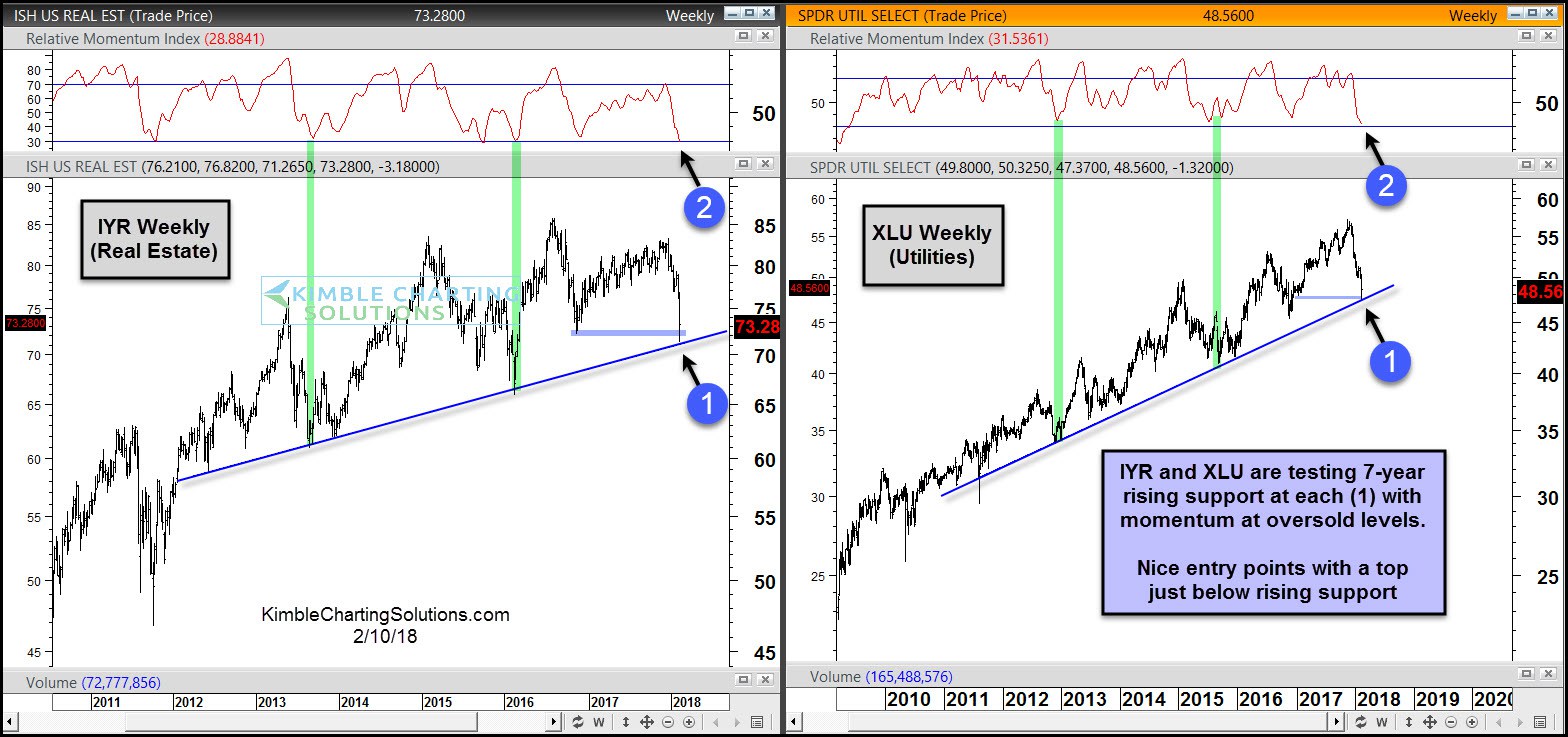
Below takes a look at the chart patterns of Real Estate (IYR) and Utilities (XLU) over the past decade:
ISH US Real EST

XLU and IYR are each testing 7-year rising support with momentum at oversold levels. When momentum was this oversold in the past 5-year, each was closer to a low than a high.

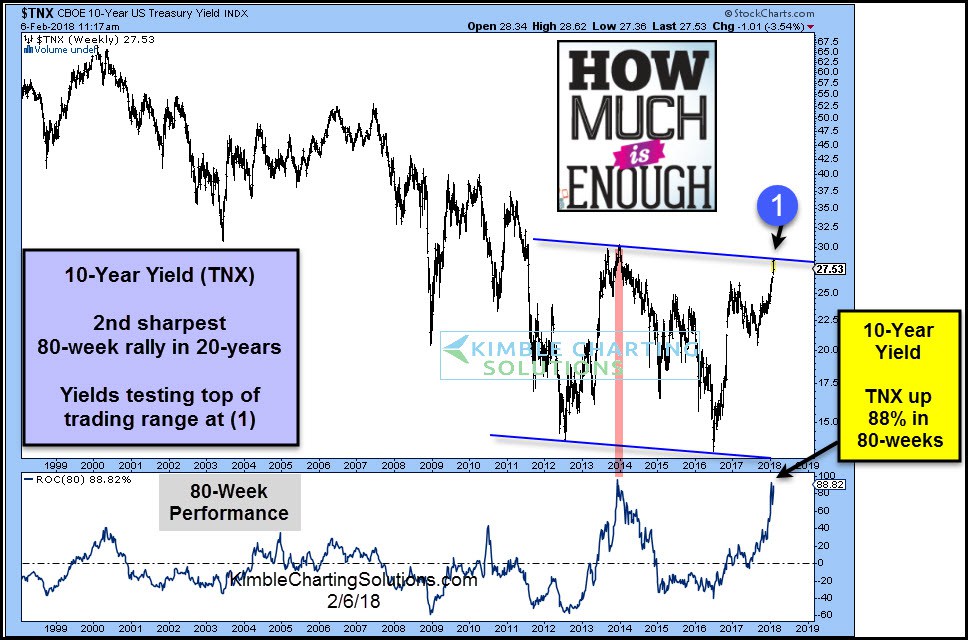
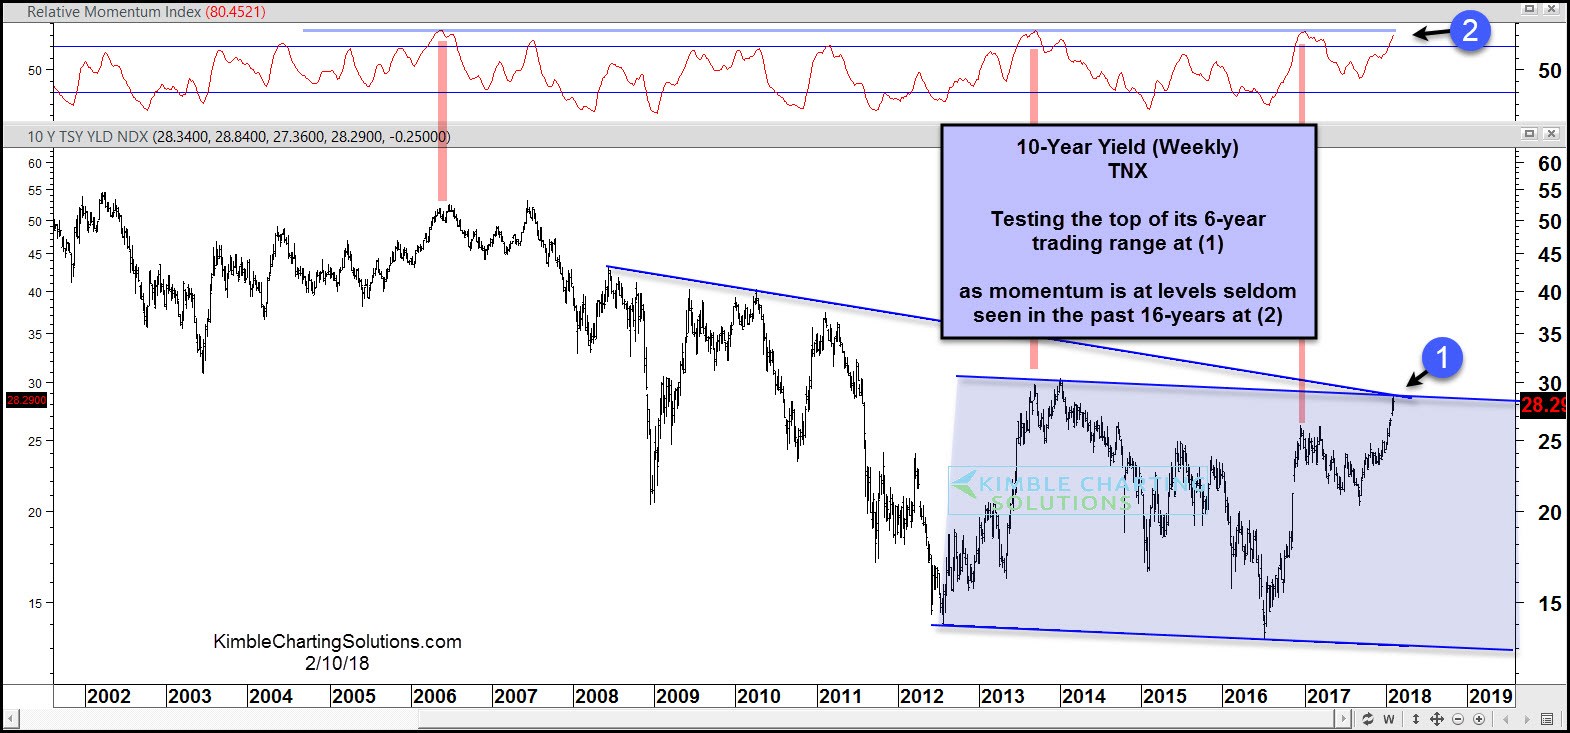
Are you thinking that XLU and IYR will continue to do poorly because interest rates are going to rise? Below looks at the yield on the 10-Year note since 1999, reflecting that yields have increased by 88% over the past 80-weeks. This sharp of rally has only taken place one other time in the past 20-years!
TNX Weekly

The sharp rally in yields now them testing the top of its 6-year rising channel at (1),as momentum in the 10-year yield is the highest in years highlighted in the chart below.
Relative Momentum Index

Bottom line– We believe that XLU and IYR are presenting buying opportunities with nice risk/reward potential, as stops can be placed just below 7-year rising support lines.

Latest comments

Loading next article…
Risk Disclosure: Trading in financial instruments and/or cryptocurrencies involves high risks including the risk of losing some, or all, of your investment amount, and may not be suitable for all investors. Prices of cryptocurrencies are extremely volatile and may be affected by external factors such as financial, regulatory or political events. Trading on margin increases the financial risks.
Before deciding to trade in financial instrument or cryptocurrencies you should be fully informed of the risks and costs associated with trading the financial markets, carefully consider your investment objectives, level of experience, and risk appetite, and seek professional advice where needed.
Fusion Media would like to remind you that the data contained in this website is not necessarily real-time nor accurate. The data and prices on the website are not necessarily provided by any market or exchange, but may be provided by market makers, and so prices may not be accurate and may differ from the actual price at any given market, meaning prices are indicative and not appropriate for trading purposes. Fusion Media and any provider of the data contained in this website will not accept liability for any loss or damage as a result of your trading, or your reliance on the information contained within this website.
It is prohibited to use, store, reproduce, display, modify, transmit or distribute the data contained in this website without the explicit prior written permission of Fusion Media and/or the data provider. All intellectual property rights are reserved by the providers and/or the exchange providing the data contained in this website.
Fusion Media may be compensated by the advertisers that appear on the website, based on your interaction with the advertisements or advertisers.
© 2007-2024 - Fusion Media Limited. All Rights Reserved.