Discounted Cash Flow (DCF) Analysis
The basic philosophy behind a DCF analysis is that the intrinsic value of a company is equal to the future earnings or cash flows of that company, discounted back to the present value. The intrinsic value is considered the actual value or “true value” of the company based on an individual’s underlying expectations and assumptions.
Finbox.io’s pre-built DCF models use consensus Wall Street forecasts as the starting assumptions. I used these pre-built analyses to filter through the 615 companies expected to report earnings this week (3/13–3/17) and found five stocks that appear to be trading far from their intrinsic value.
3 Undervalued Stocks To Watch
SEACOR Holdings Inc (NYSE:CKH) is expected to report earnings on Wednesday after the market closes. Analysts expect fiscal 2016 EBITDA to fall by a third and then quickly recover in 2017. The DCF analysis concludes a fair value of approximately $96.00 per share implying the stock has over 45% upside. However, note Wall Street’s rosy margin expansion over the five year projection period which may prove difficult to achieve.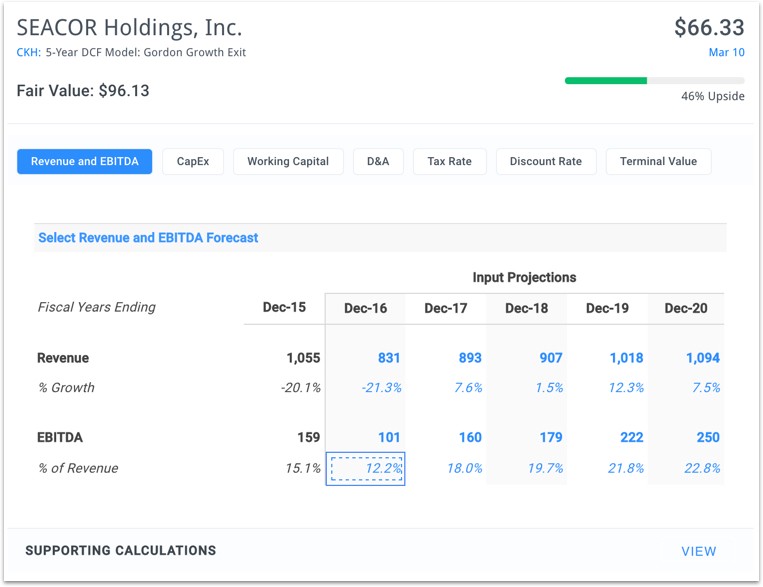
Oracle Corporation (NYSE:ORCL) is also expected to report earnings on Wednesday after the market closes. The company’s shares last traded at $42.54 as of Friday, right at its 52 week high. However, the DCF analysis below implies that the stock is still 30% undervalued based on the Street’s projections.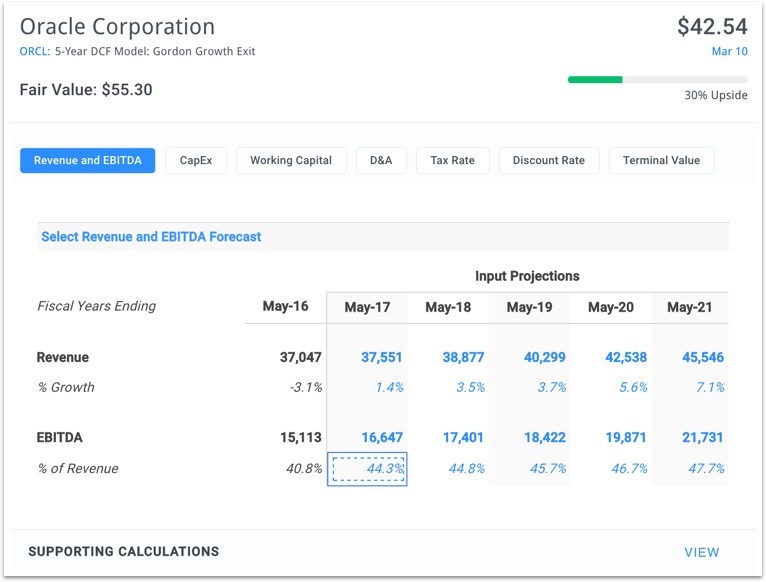
DSW Inc (NYSE:DSW) is expected to report earnings on Tuesday before the market opens. The company’s shares last traded at $20.75 as of Friday, only 69% of its 52 week high. Fiscal year 2017 revenues are expected to improve by 4.0% while EBITDA margins are expected to decline to 9.7% from 11.2%. Even with minimal growth and margin expansion after 2017, the future cash flow analysis highlights nearly 25% upside.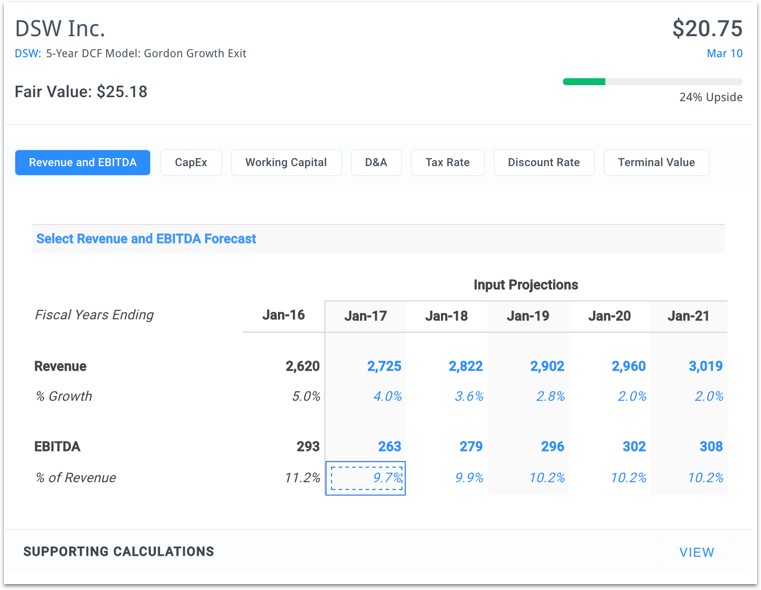
2 Overvalued Stocks To Watch
Hd Supply H (NASDAQ:HDS) is expected to report earnings on Tuesday before the market opens. The company is expected to report minimal growth and margin expansion in fiscal year 2017. However, Wall Street expects growth to ramp up with EBITDA reaching $1,394 million by fiscal year 2021. This represents a five year EBITDA CAGR of 10%. The DCF analysis concludes that the stock is nearly 20% overvalued even with this bullish outlook.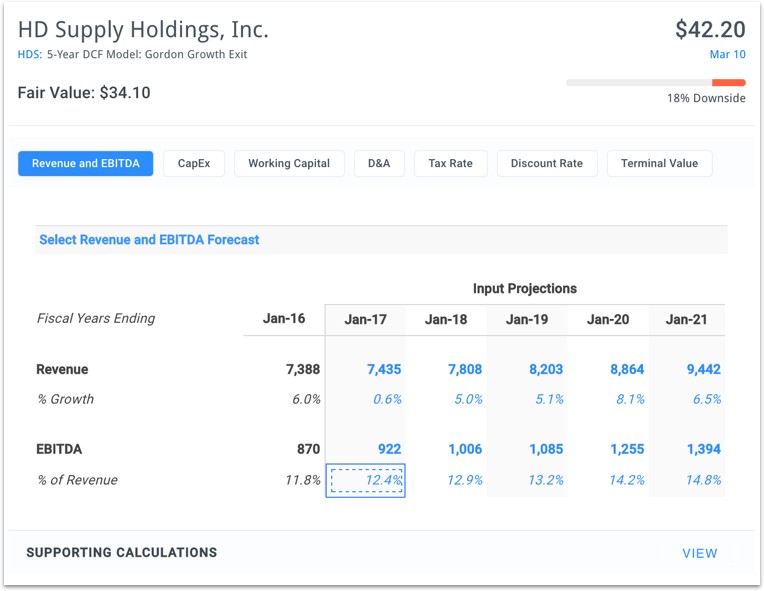
Tiffany & Co. (NYSE:NYSE:TIF) is expected to report 2017 full year revenues of $3,992 million and EBITDA of $952 million on Friday before the market opens. With meager growth and margin expansion thereafter, the five year valuation model indicates that shares are 17% overvalued.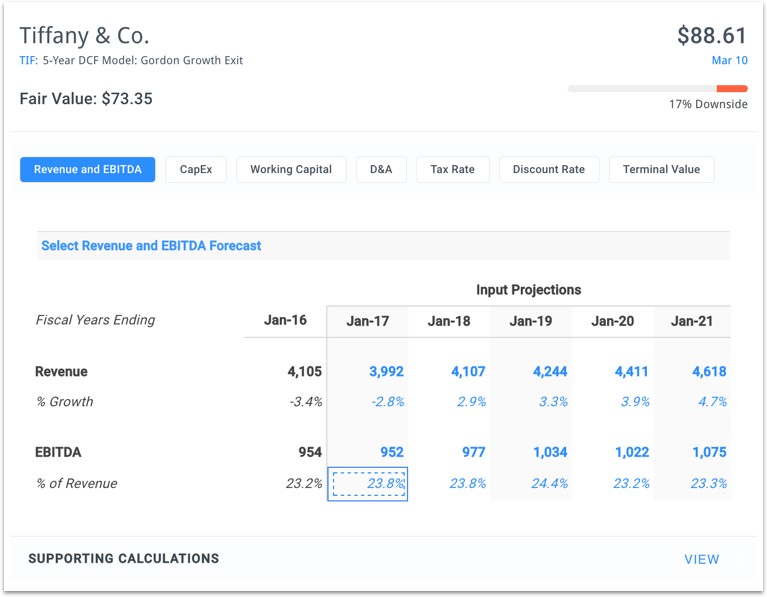
A DCF analysis can seem complex at first but it’s worth adding to your investment analysis toolbox since it provides the clearest view of company value.
Value investors may want to take a closer look at the names listed above. Don’t be surprised if these stocks begin to trade closer to their intrinsic value following their earnings release.
