
A manufacturing recession doesn’t matter… until it does. Consider industrial production. For the third straight month, industrial production, which includes mining, utilities, as well as manufacturing, contracted.
How anemic is American industry right now? The year-over-year percentage change provides a helpful snapshot of the weakness.

Not surprisingly, media mega-stars routinely dismiss manufacturers, miners and utility providers as relics of yesterday’s economy. They maintain that consumers are the only ones who count in a consumption-based society. The erosion of the high-paying careers in those segments notwithstanding, might the rosy projections for household consumption be misleading? After all, retail sales (ex auto) pulled back 0.1% in December, even as economists anticipated 0.2% growth.
We can look at consumer trends in a variety of ways. As I pointed out in my most recent commentary (1/12/16), year-over-year percent growth in personal consumption expenditures (PCE) has been declining steadily for roughly 18 months. Meanwhile, year-over-year percentage changes in retail sales (ex auto) emulate what is taking place in American industry.

So what happened to the “clear-cut” benefit of lower oil prices? Weren’t they supposed to be a giant tax cut for the American consumer, prompting them to spend? Not when wage growth is tepid. And not when many households have chosen to increase their savings.
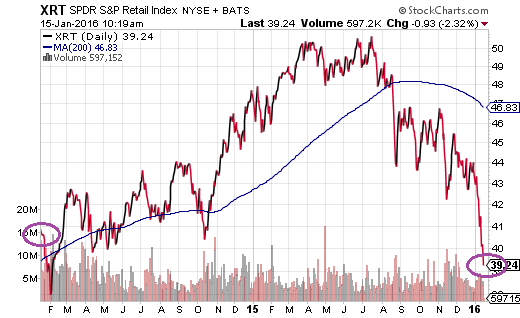
It should not go unnoticed that the SPDR S&P Retail (N:XRT) has quickly descended into bear territory. The S&P SPDR Retail ETF (XRT) is currently down about 22.3%. Even more disheartening for those who had not become more defensive in their asset allocation over the past year? The price of XRT is lower than it was two years ago.
Ironically enough, the question is no longer whether U.S. stocks have entered a bear market in the same way that the retail segment has. Indeed, Bespoke Research already demonstrated that the average large-company stock, the average mid-sized company stock and the average small-company stock have all surpassed the 20% bear market threshold. In the same vein, the median stock in the Russell 3000 and the Value Line Index show the same.
The only question now is whether or not there will be enough buying interest in market-cap weighted indices like the S&P 500 and the Dow Jones Industrials to avoid a similar fate. The SPDR S&P 500 (N:SPY) does have impressive support at the 185 level.

In my estimation, the best shot that the major benchmarks have in avoiding a “bear market headline” is the same injection that occurred during the euro-zone crisis in 2011. Specifically, nearly all of the U.S. indexes and overseas benchmarks fell 20%-40% during that summer. The Dow and the S&P 500 escaped a similar fate with depreciation of “just” 19%-19.9%, due to “well-timed” stimulus promises by the European Central Bank (ECB) and the U.S. Federal Reserve.
Already, Fed fund futures have pushed out their anticipation of a second rate hike out to Q3 (July-September) from March. The market does not believe the Fed party line of 4 rate hikes in 2015. In fact, if the Dow and the S&P 500 do fall to significantly lower levels, one might anticipate the central bank of the United States reversing course; perhaps the notion of negative interest rates and/or QE4 might be introduced to the investing public.
Historically speaking, however, the wildcard of a Fed reversal may not be enough to calm the nerves of panicky market-based participants. Take a look at this table for the S&P 500’s first five trading days in January. (Note: I won’t even incorporate the horrific second week that investors are dealing with right now.)

The worst first five days for the S&P 500 occurred right here in 2016. But that’s not all. In the table, seven of the nine worst starts ultimately offered poor risk-reward results, either with additional losses or sub-par total gains through year-end.
“Wait a second, Gary. Those other two years in 1991 and in 1982 show extraordinary price appreciation. Isn’t that reason enough to be optimistic?” Not if you recognize that the price gains that occurred in 1991 came at the conclusion of the 20% losses for the 1990-1991 stock market bear. And not if you realize that the price appreciation that followed in 1982 came at the end of the 27% losses for the 1981-1982 stock market bear.
Right now, we’re not coming off of a 20% price collapse of the S&P 500. It follows that to the extent one wants to take the history of market direction into account, one would have to look at 2016’s prospects in an unfavorable light.
Disclosure: Gary Gordon, MS, CFP is the president of Pacific Park Financial, Inc., a Registered Investment Adviser with the SEC. Gary Gordon, Pacific Park Financial, Inc, and/or its clients may hold positions in the ETFs, mutual funds, and/or any investment asset mentioned above. The commentary does not constitute individualized investment advice. The opinions offered herein are not personalized recommendations to buy, sell or hold securities. At times, issuers of exchange-traded products compensate Pacific Park Financial, Inc. or its subsidiaries for advertising at the ETF Expert web site. ETF Expert content is created independently of any advertising relationships.