
 EUR/USD Daily Chart" title="EUR/USD Daily Chart" width="474" height="242">
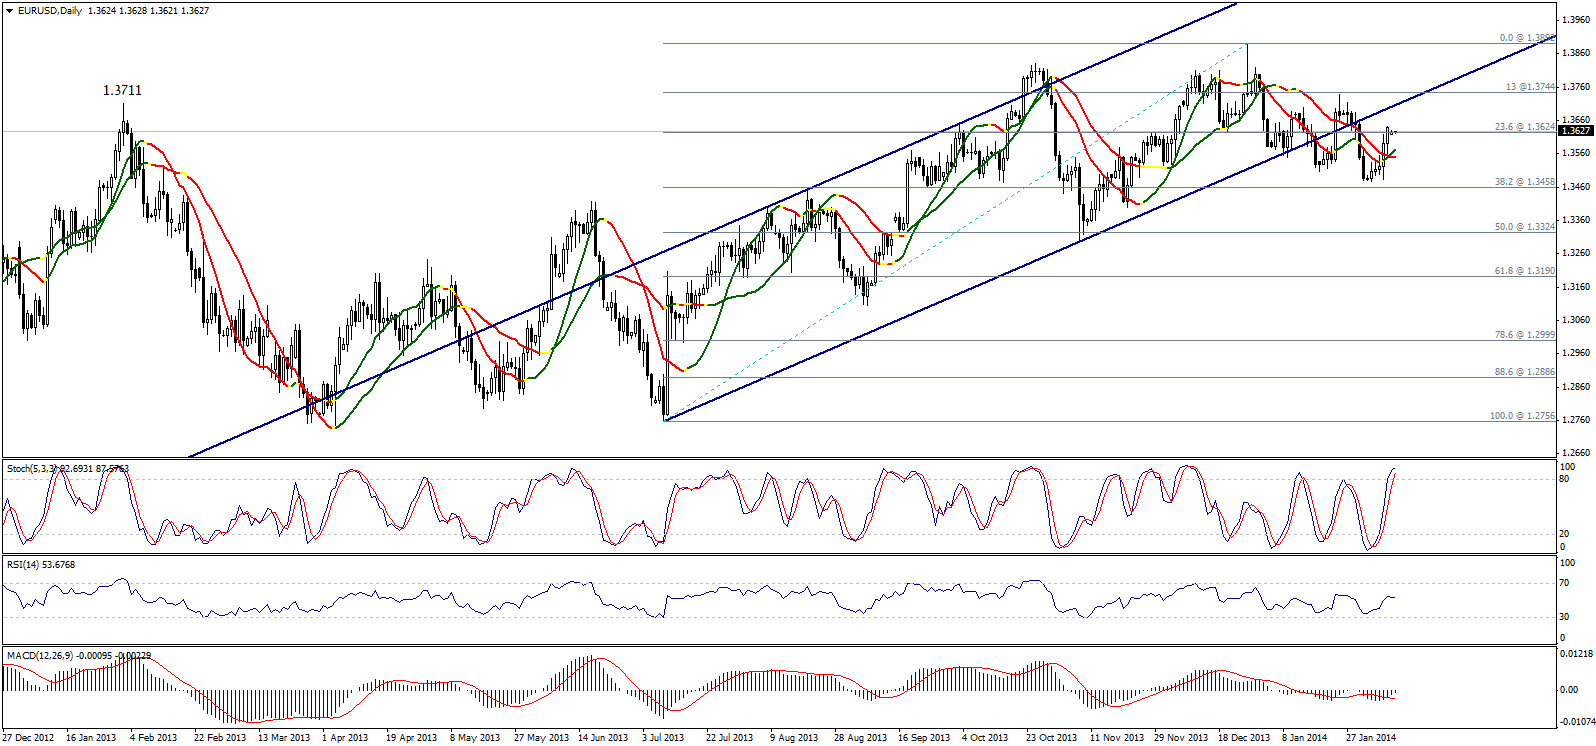
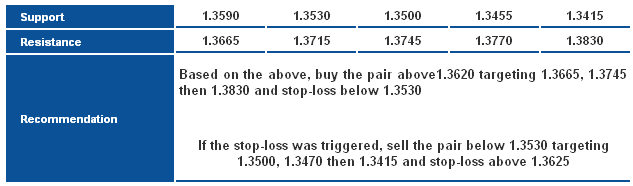
The pair moved to the upside last week and traded above 23.6% correction at 1.3625 levels showing on graph. Stabilizing above the referred to level might extend the upside move that is a possible retest of the broken support of the ascending channel that turned to resistance as shown on graph.
In fact, the upside move requires breaching 1.3745 this week, if not the downside move will return and the upside move will be a retest. On the other hand, breaking 1.3530 will bring negativity again.
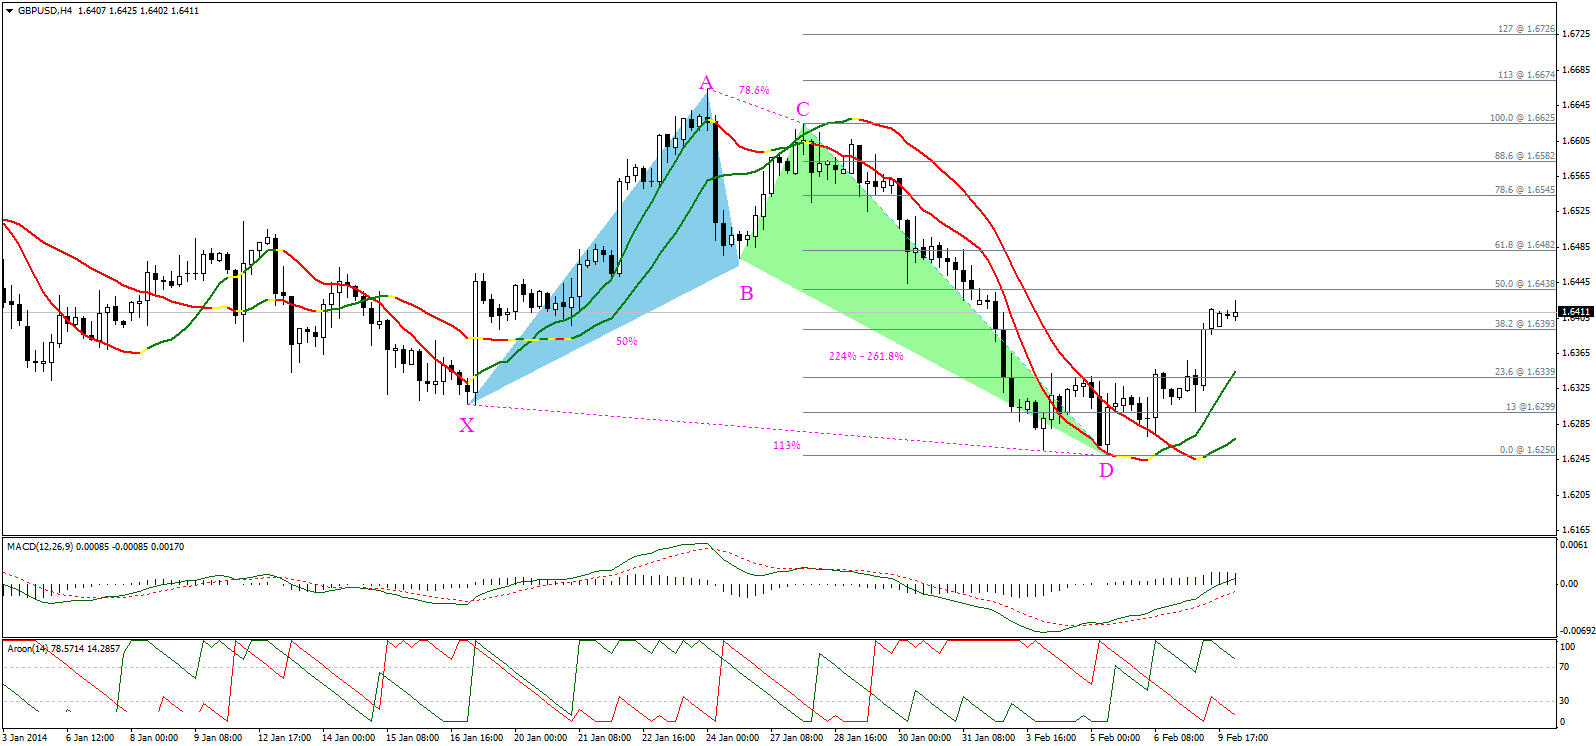
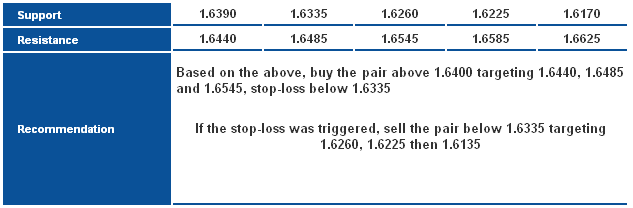
The pair managed to move to the upside and stabilized above 1.6390 which is positive because it favors extending bullishness of the alternative Bat Pattern as showing on graph. Based on technical analysis rules, stabilizing above the referred to level represented in 38.2% correction might extend bullishness towards 1.6485.
Of note, 1.6485 level determines the bullish extension, whereas breaching it might extend the upside move towards 1.6545 while failing to breach will bring the overall downside move again.
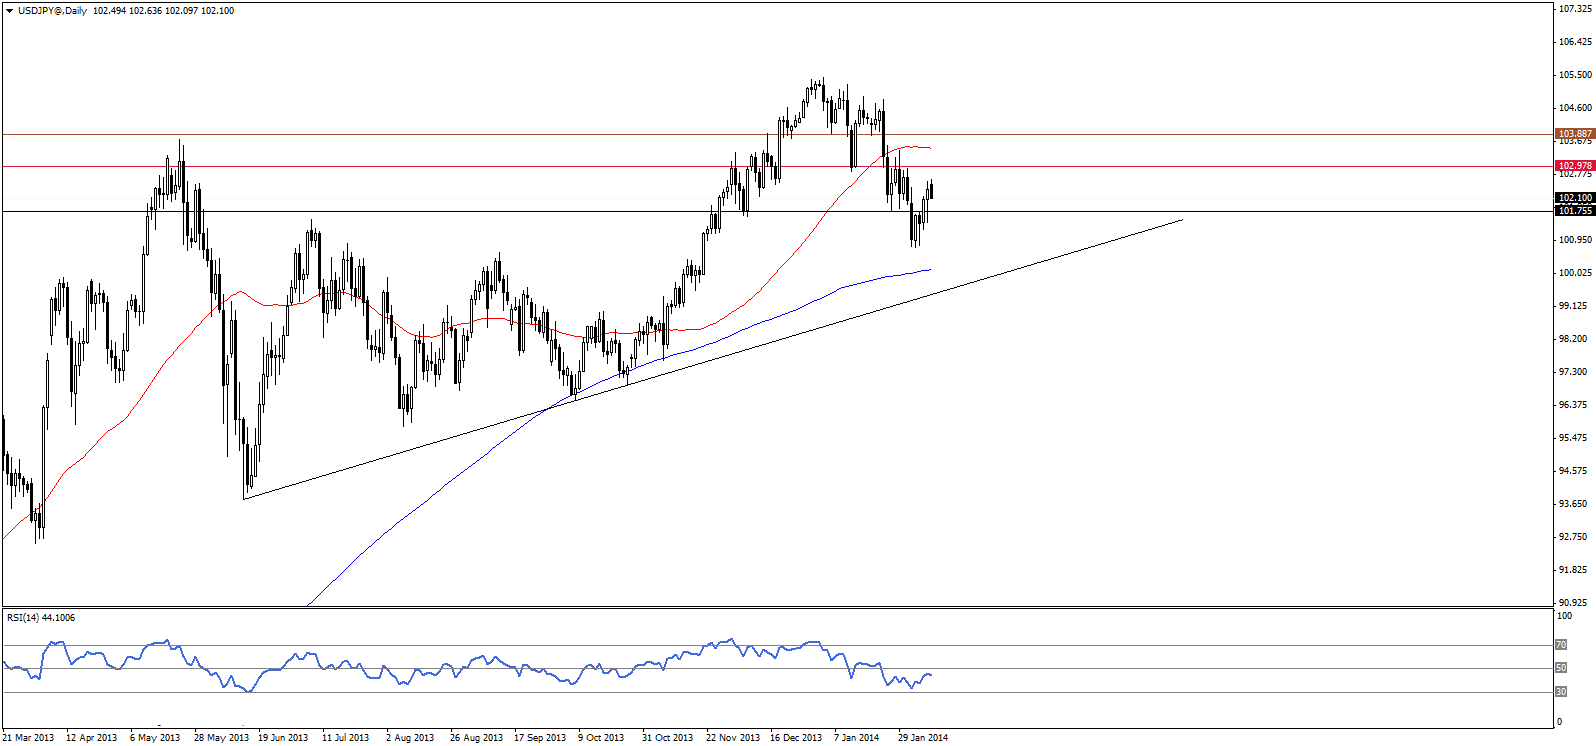
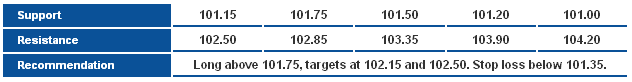
The USD/JPY extended the bullish rebound on Friday, as the price maintained trading above 101.75 support level, which enhanced the technical picture slightly over the short term. However, the overall bearish wave that started from 105.45 top is sill intact, and accordingly, we expect a sideways this week.
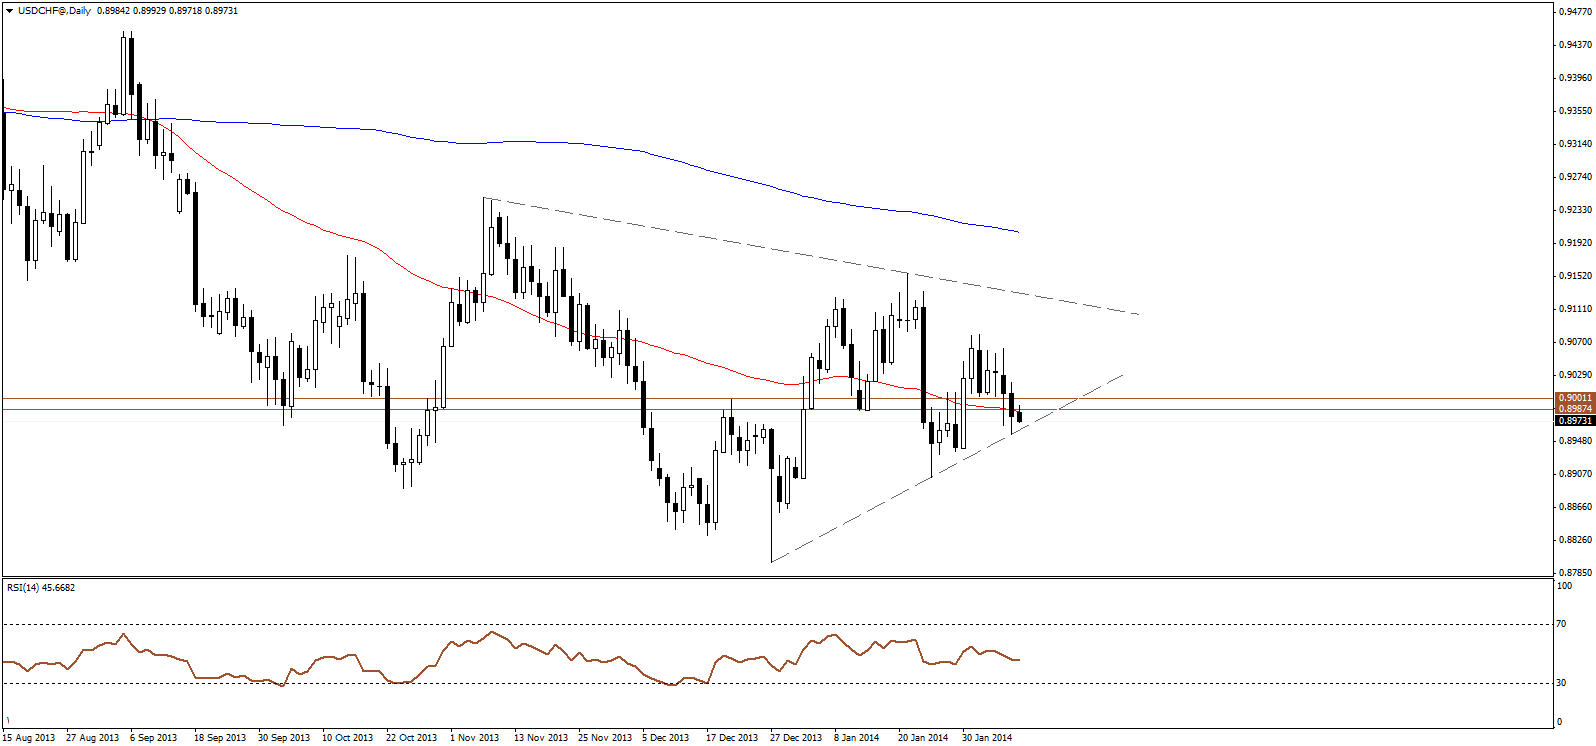
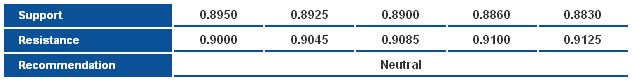
The USD/CHF is under pressure, settling at the rising trend line for the recent bullish wave as shown on the daily chart above, where breaking below the trend line should confirm further downside as price has tentatively broken below the 50-days SMA and 0.9000 horizontal support as well.
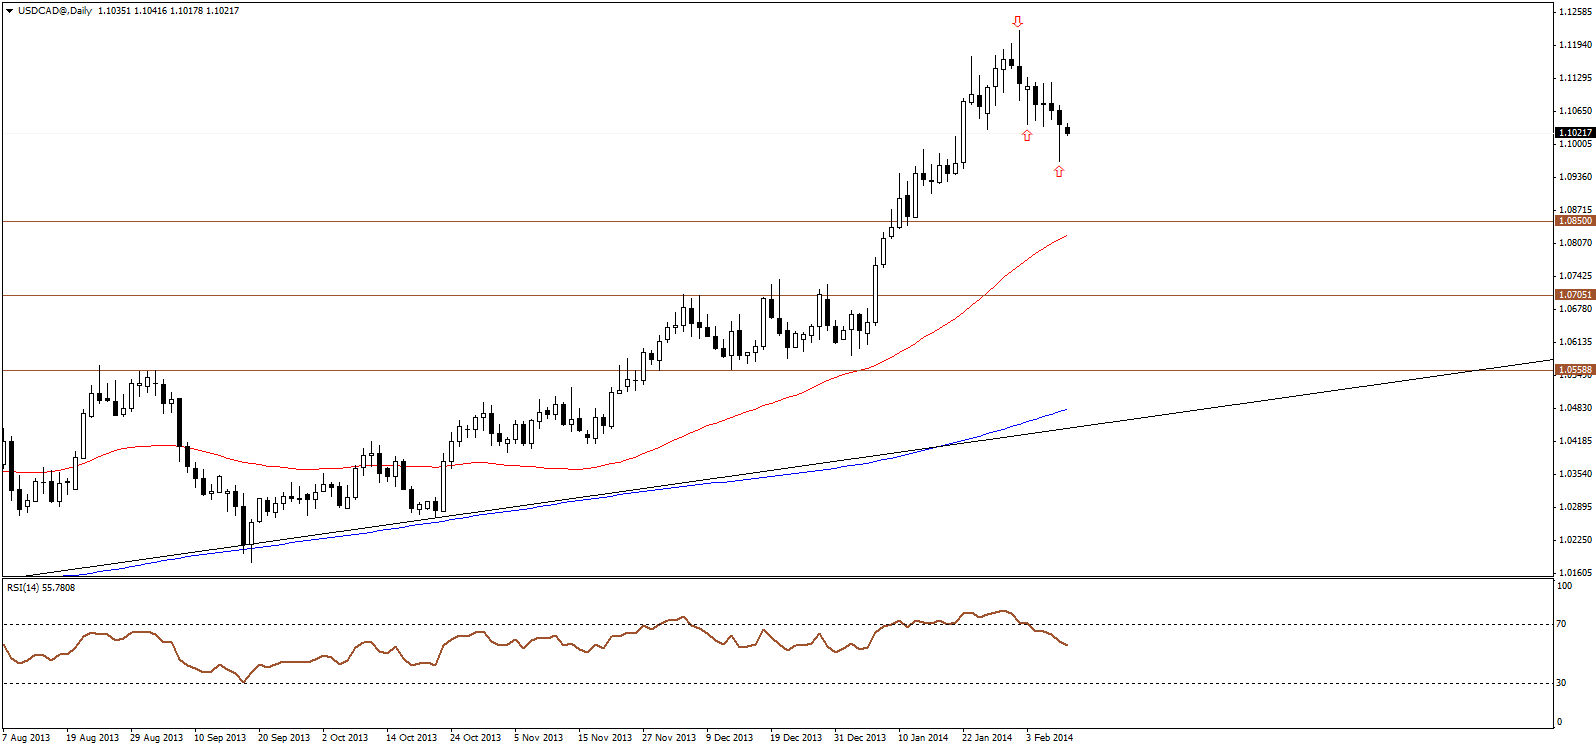
The USD/CAD is pushing lower, however the price is forming long lower shadows candles, indicating renewed demand on every sell-off, and that hints the possibility of resuming the bullish trend this week. The selloff on Friday found strong support at 1.0000 psychological level and thus we expect this level to hold.

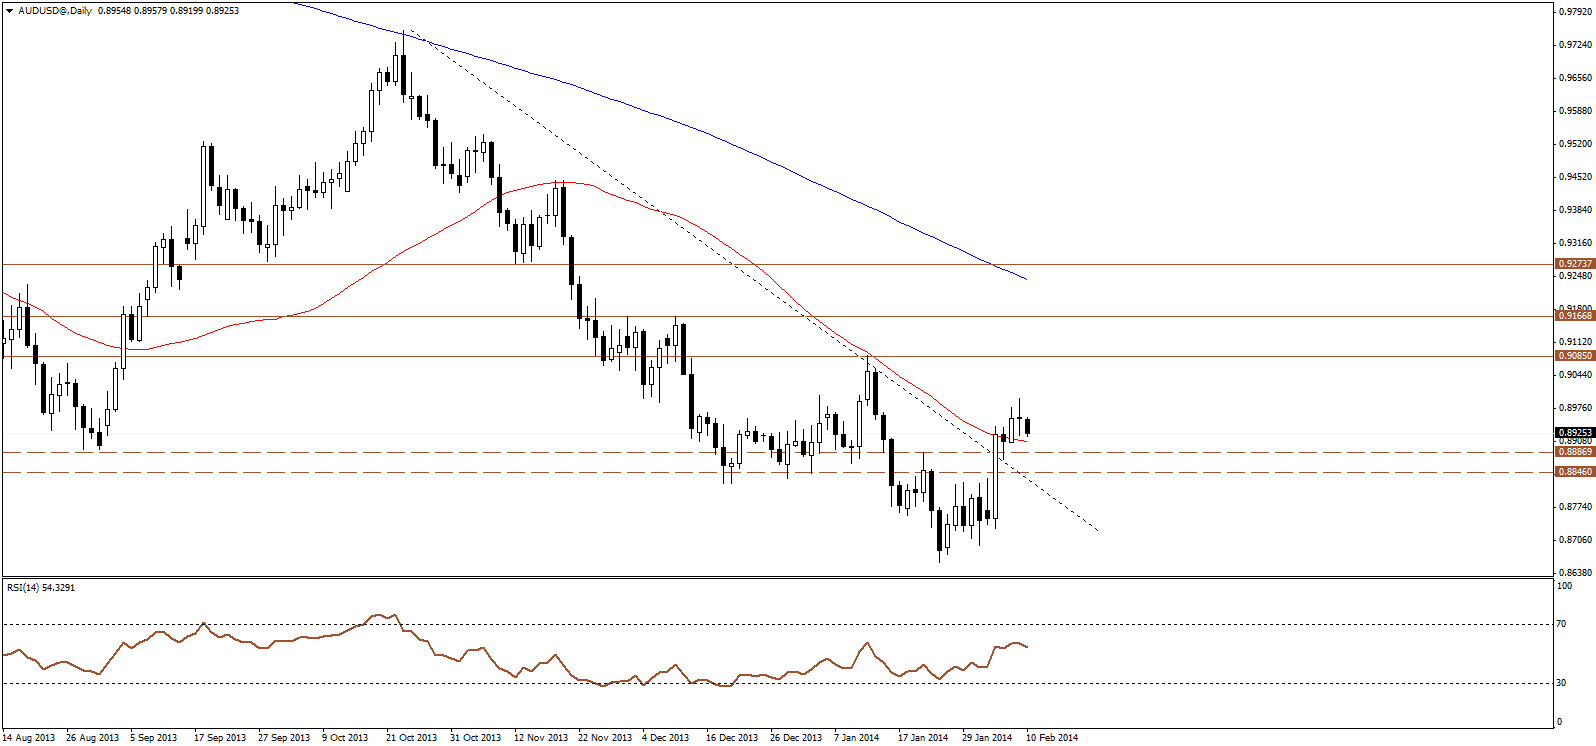
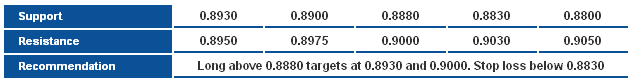
The pair formed a long legged doji candle on Friday, and that hints major indecision among traders, and indicate we may see some renewed downside pressure, however so long as above 0.8845 support level we will maintain our bullish correctional bias targeting 0.9085.
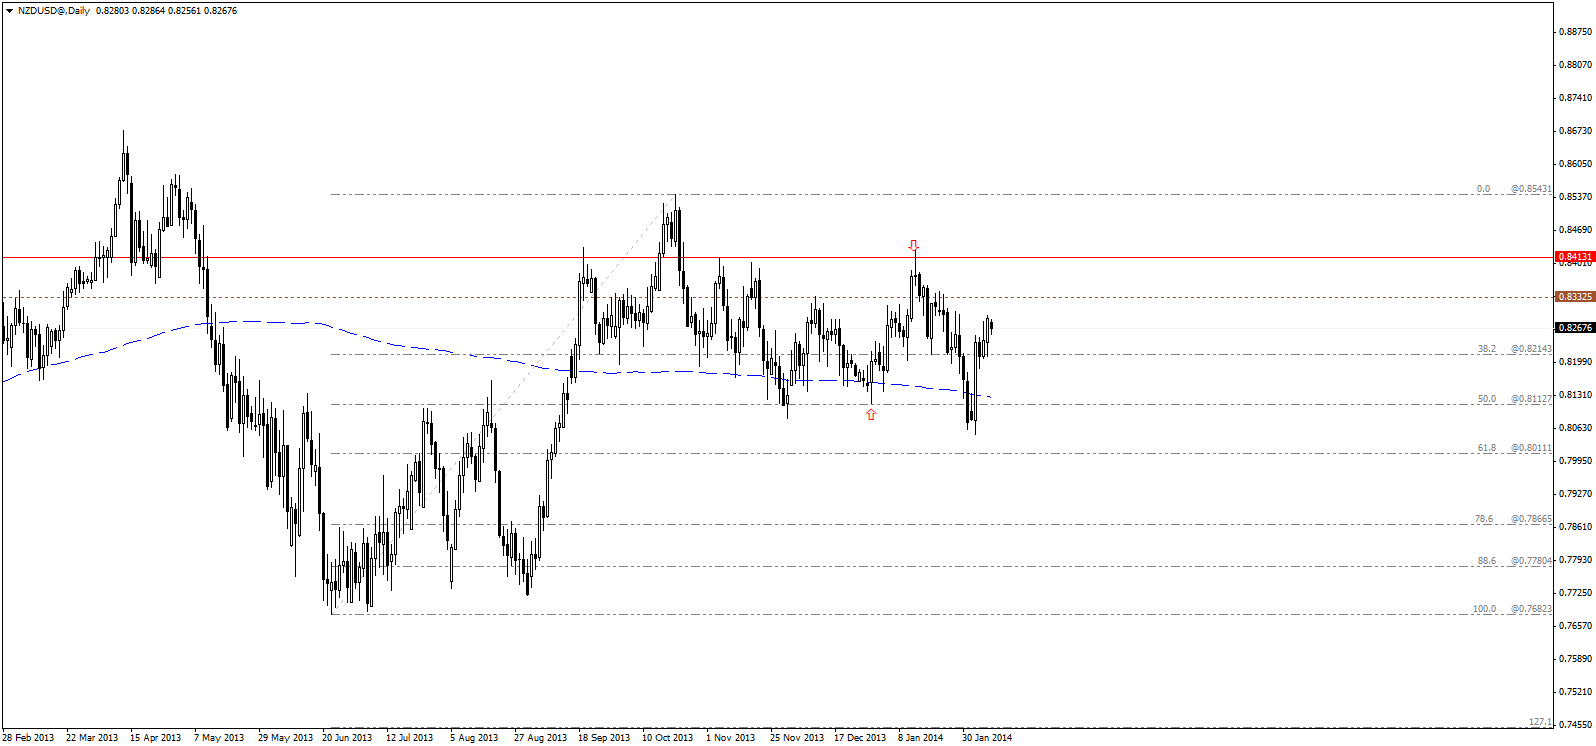
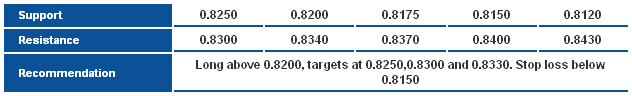
The NZD/USD extended the strong bullish rebound on Friday, settling back above 0.8200 resistance level, which may turn to a support and a floor for short term trading. The next upside target resides at 0.8330 key resistance level.
3rd party Ad. Not an offer or recommendation by Investing.com. See disclosure here or
remove ads
.