
EUR/USD EUR/USD" title="EUR/USD" width="620" height="414">
The pair dropped again and is trading below 23.6% correction of CD Leg of the AB=CD bearish Harmonic Pattern and the pair might reach the first target of the pattern at 1.3440 levels. Stability below Linear Regression Indicators and the bearish bias on RSI support the possibility of moving to the downside today. Stochastic is trying to crossover positively and accordingly areas of 1.3600 should hold for the downside move to remain valid. We should point out that the bearish move is still considered only correction at the time being.
The trading range for today is among the key support at 1.3355 and key resistance at 1.3710.
The general trend over short term basis is to the upside targeting 1.4375 as far as areas of 1.3320 remains intact.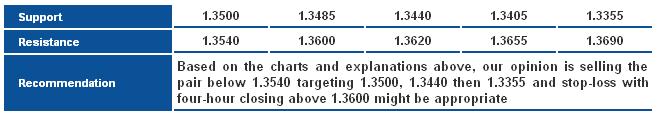 EUR/USD_S&R" title="EUR/USD_S&R" width="658" height="115">
GBP/USD GBP/USD" title="GBP/USD" width="620" height="414">
Despite the thin trading yesterday, the pair is stable below 1.5690 levels forcing us to hold on to expectations for the pair to extend the overall downside move of the pair. Trading below 1.5825 levels is considered negative, but for today the pair should stay stable below 1.5765 levels in order not to trigger any bullish rebounds affected by the oversold signals on Stochastic. Linear Regression Indicators are negative and support our expectations.
The trading range for today is among key support at 1.5500 and key resistance at 1.5825.
The general trend over short term basis is to the downside targeting 1.4225 as far as areas of 1.6875 remains intact.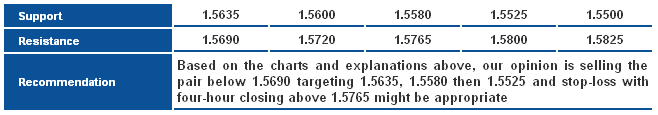 GBP/USD_S&R" title="GBP/USD_S&R" width="658" height="115">
USD/JPY USD/JPY" title="USD/JPY" width="620" height="414">
The pair managed to remain stable above Linear Regression Indicators despite the slight drop yesterday. The indicators are trading positively pointing to an upside move that is likely to extend. Trading above 92.70 levels will keep the possibility of the upside move valid over intraday basis today.
The trading range for today is among key support at 92.05 and key resistance at 95.50.
The general trend over short term basis is to the upside targeting 100.00 as far as areas of 84.00 remain intact.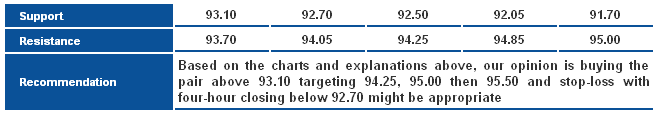 USD/JPY_S&R" title="USD/JPY_S&R" width="659" height="116">
USD/CHF USD/CHF" title="USD/CHF" width="620" height="414">
The upside move was halted yesterday and the pair is back trading closely above 0.9080 support. Stability above this support might extend the upside attempts whereas Stochastic is still holding onto its bullish bias. Breaking 0.9000 levels will fail the upside possibility today.
The trading range for today is among key support at 0.9155 and key resistance at 0.9465.
The general trend over short term basis is to the downside stable at levels 0.9775 targeting 0.8860.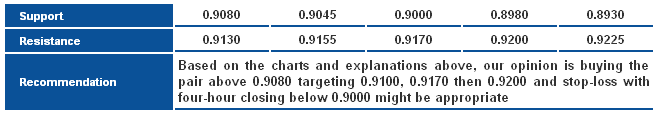 USD/CHF_S&R" title="USD/CHF_S&R" width="656" height="118">
USD/CAD USD/CAD" title="USD/CAD" width="620" height="414">
The pair’s trading has been thin the past few days forcing us to be neutral while stabilizing between 1.0005 levels from the upside and 50% correction shown on the graph. Linear Regression Indicators are negative and the pair is trading above it, also stability above 50% correction is conflicted by the bearishness on Stochastic. Therefore, we prefer to be neutral as we said and recommend checking the “recommendations” section waiting for new intraday signals for the pair.
The trading range for today is between the key support at 0.9875 and the key resistance at 1.0120.
The general trend over short term basis is to the downside below levels 1.0125 targeting 0.9400.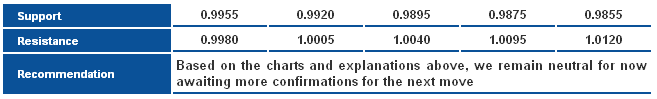 USD/CAD_S&R" title="USD/CAD_S&R" width="657" height="99">
AUD/USD AUD/USD" title="AUD/USD" width="620" height="414">
The pair stabilized below 1.0344 levels keeping the possibility of extending the downside move. Despite oversold signals on Stochastic, the negativity of Linear Regression Indicators and exiting the ascending channel support the suggested scenario unless we have a breakout above 1.0440 levels during today’s session.
The trading range for today is among key support at 1.0185 and key resistance at 1.0440.
The general trend over short term basis is to the downside below levels 1.0710 targeting 0.9400.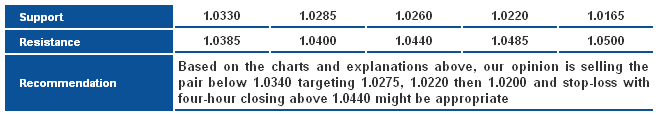 AUD/USD_S&R" title="AUD/USD_S&R" width="658" height="115">
NZD/USD NZD/USD" title="NZD/USD" width="620" height="414">
The pair dropped sharply failing attempts to stabilizing above minor resistance levels that became significant as shown on the graph. Meanwhile, the pair is stable above 0.8355 levels forcing us to remain neutral today. Linear Regression Indicators are becoming negative and Stochastic is still moving to the downside, therefore we do not trust 0.8355 levels and will wait for new confirmations.
The trading range for today might be among key support at 0.8275 and key resistance at 0.8480.
The general trend over short term basis is to the upside with steady daily closing above 0.8130 targeting 0.8845.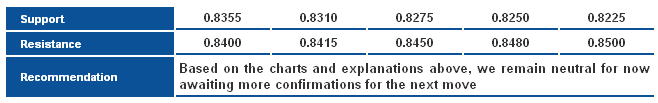 NZD/USD_S&R" title="NZD/USD_S&R" width="658" height="103">
GBP/JPY GBP/JPY" title="GBP/JPY" width="620" height="414">
Trading is biased upside - a case normal in light of stability above 144.30 that preserve chances for the extension of the uptrend, and proceed to touch 148.25. Stochastic assumed a positive crossover that might expose the pair to some positive demand and has influenced the positive momentum as well. We note the importance of settling above 147.05 until trading returns to above Linear Regression Indicators.
The trading range expected for today is between the key support at 144.30 and the key resistance at 148.75.
The short-term trend is downside targeting 112.00 as 150.00 remains intact.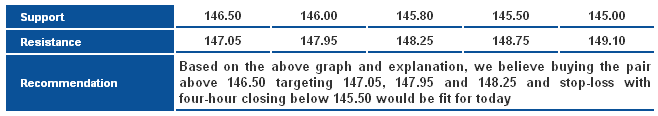 GBP/JPY_S&R" title="GBP/JPY_S&R" width="658" height="116">
EUR/JPY EUR/JPY" title="EUR/JPY" width="620" height="414">
Slight correction suffice the pair to stay above Linear Regression Indicators -- a positive event cementing potential uptrend continuity. Stochastic has demonstrated a positive crossover despite being in overbought areas, backing the scenario suggested above. Stability above 126.15 is intraday key to maintining our positive outlook.
The trading range expected for today is between the key support at 124.10 and the key resistance at 128.75.
The short-term trend is upside targeting 128.75 as 109.45 remains intact by weekly closing.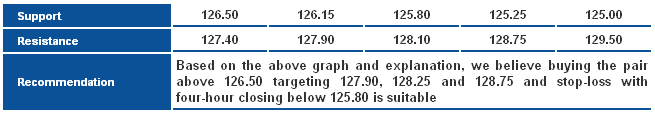 EUR/JPY_S&R" title="EUR/JPY_S&R" width="655" height="113">
EUR/GBP EUR/GBP" title="EUR/GBP" width="620" height="414">
Technical indicators are conflictive. Linear Regression 34 is negative and 55 is neutral, momentum indicators attempt to enter positivity however, at the same time, the pair is below LRIs repelling the momentum indicators effects. Therefore, we advise standing neutral for today.
The trading range expected today is between the key support at 0.8535 and the key resistance at 0.8760.
The short-term trend is upside targeting 1.0370 as 0.7785 remains intact.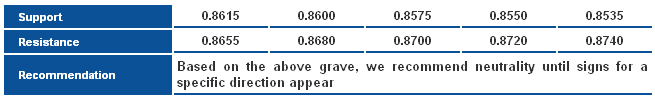 EUR/GBP_S&R" title="EUR/GBP_S&R" width="655" height="101">
- English (UK)
- English (India)
- English (Canada)
- English (Australia)
- English (South Africa)
- English (Philippines)
- English (Nigeria)
- Deutsch
- Español (España)
- Español (México)
- Français
- Italiano
- Nederlands
- Português (Portugal)
- Polski
- Português (Brasil)
- Русский
- Türkçe
- العربية
- Ελληνικά
- Svenska
- Suomi
- עברית
- 日本語
- 한국어
- 简体中文
- 繁體中文
- Bahasa Indonesia
- Bahasa Melayu
- ไทย
- Tiếng Việt
- हिंदी
Daily Technical Report Of Major And Cross Currencies: February 7
Published 02/07/2013, 04:10 AM
Updated 07/09/2023, 06:31 AM
Daily Technical Report Of Major And Cross Currencies: February 7
Latest comments
Loading next article…
Install Our App
Risk Disclosure: Trading in financial instruments and/or cryptocurrencies involves high risks including the risk of losing some, or all, of your investment amount, and may not be suitable for all investors. Prices of cryptocurrencies are extremely volatile and may be affected by external factors such as financial, regulatory or political events. Trading on margin increases the financial risks.
Before deciding to trade in financial instrument or cryptocurrencies you should be fully informed of the risks and costs associated with trading the financial markets, carefully consider your investment objectives, level of experience, and risk appetite, and seek professional advice where needed.
Fusion Media would like to remind you that the data contained in this website is not necessarily real-time nor accurate. The data and prices on the website are not necessarily provided by any market or exchange, but may be provided by market makers, and so prices may not be accurate and may differ from the actual price at any given market, meaning prices are indicative and not appropriate for trading purposes. Fusion Media and any provider of the data contained in this website will not accept liability for any loss or damage as a result of your trading, or your reliance on the information contained within this website.
It is prohibited to use, store, reproduce, display, modify, transmit or distribute the data contained in this website without the explicit prior written permission of Fusion Media and/or the data provider. All intellectual property rights are reserved by the providers and/or the exchange providing the data contained in this website.
Fusion Media may be compensated by the advertisers that appear on the website, based on your interaction with the advertisements or advertisers.
© 2007-2024 - Fusion Media Limited. All Rights Reserved.