
EUR/USD: European Session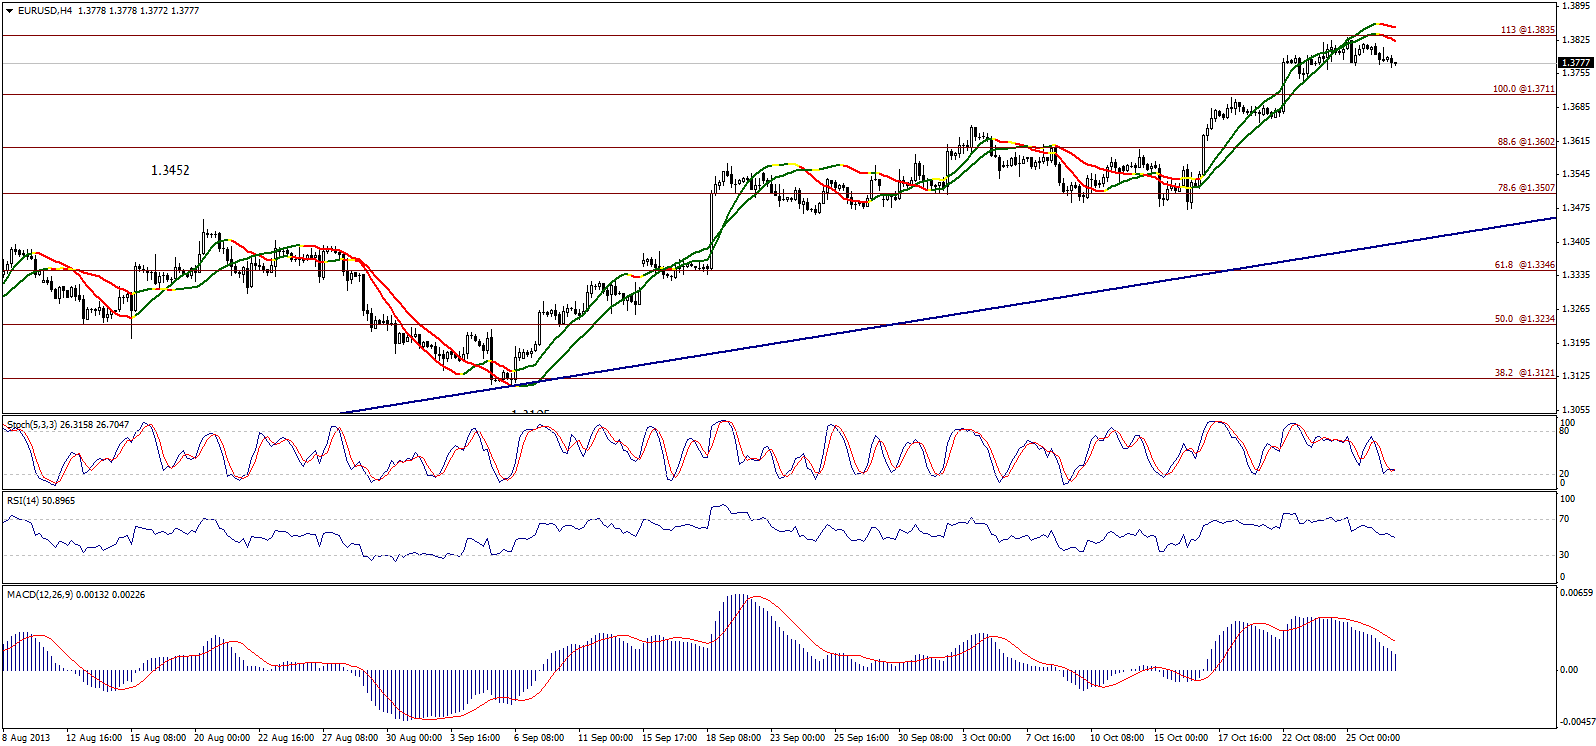 EUR/USD Hourly Chart" title="EUR/USD Hourly Chart" width="628" height="113">
The pair dropped slightly yesterday triggered by Linear Regression Indicators turning negative. Stability below 1.3835 and failing to breach it is the main reason behind the bullish extension failure, as we think that trading below this level will extend the downside move reaching 1.3710 levels at least. Therefore, there is a possibility of extending the bearish correction.
**The trading range for today is among the key support at 1.3655, and key resistance at 1.3910.
**The general trend over short term basis is to the upside with daily closing between 1.3385 and 1.3970. EUR/USD S&R" title="EUR/USD S&R" width="628" height="113">
GBP/USD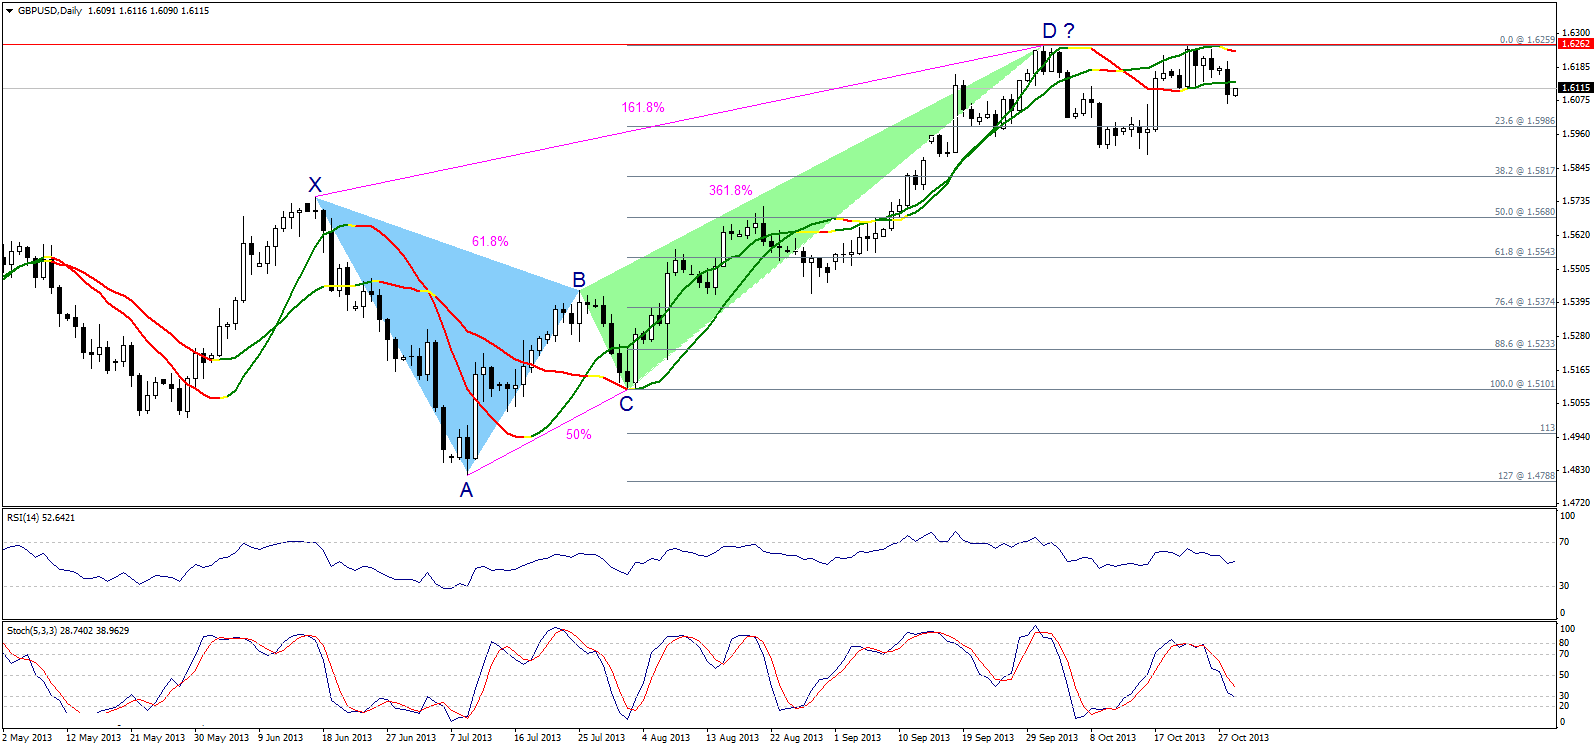 GBP/USD Daily Chart" title="GBP/USD Daily Chart" width="628" height="113">
The pair dropped yesterday affected by the bearish harmonic Crab Pattern pushing the pair to trade below Linear Regression Indicators. Stability below 1.6170 supports extending negativity, as we think that the pair will move further to the downside. Breaking 1.5985 might support our expectations.
**The trading range for today is among the key support at 1.5815, and key resistance at 1.6265.
**The general trend over short term basis is to the upside with daily closing between 1.5280 and 1.6540. GBP/USD S&R" title="GBP/USD S&R" width="628" height="113">
USD/JPY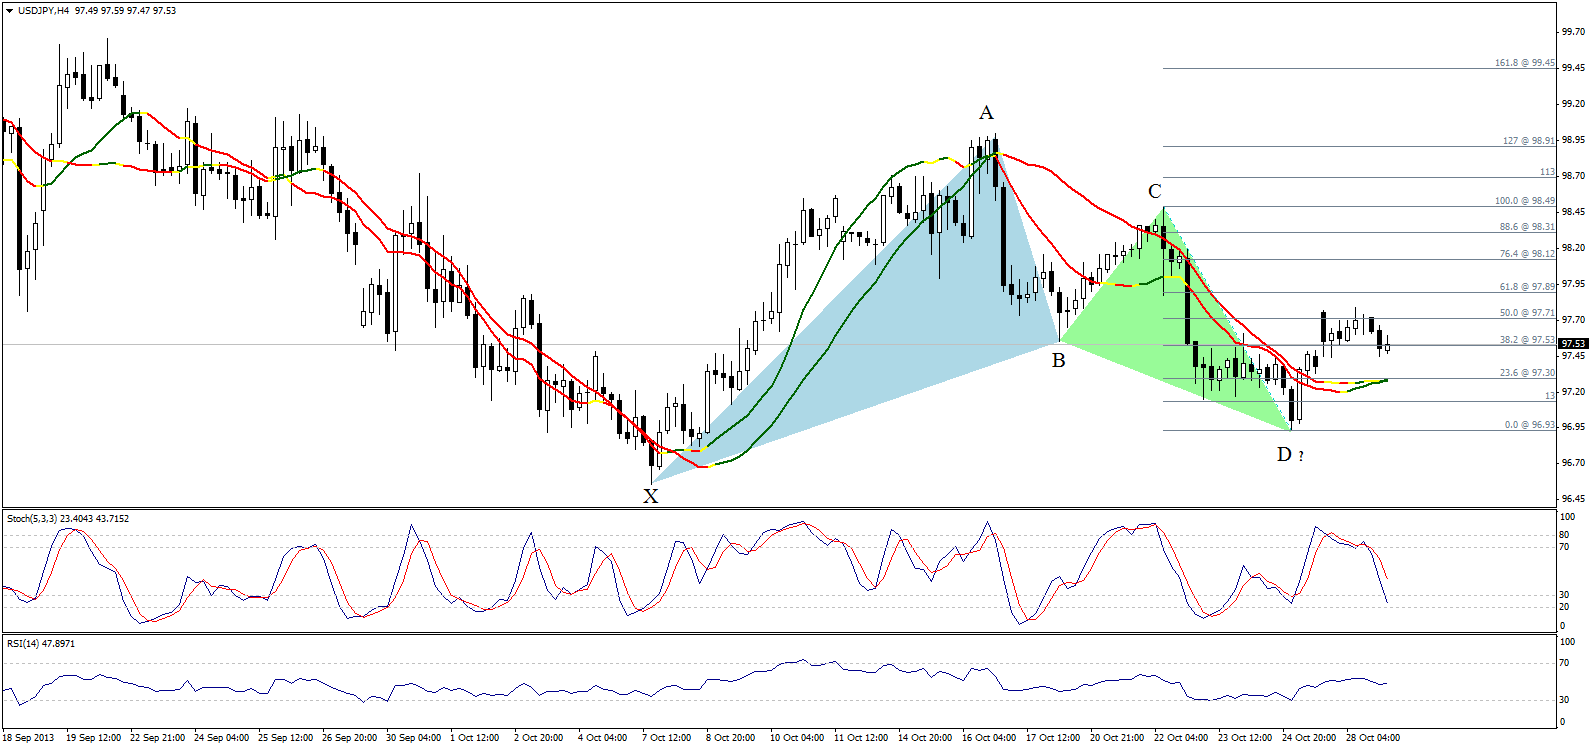 USD/JPY Hourly Chart" title="USD/JPY Hourly Chart" width="628" height="113">
The pair failed to breach 97.70 levels which triggered some bearishness. The downside move is still limited above Linear Regression Indicators and above 23.6% correction of CD Leg of the bullish harmonic Bat Pattern. Stability above 97.30 keeps the harmonic pattern’s affect and we might witness a new attempt to the upside today that remains valid unless the pair breaks 96.80 levels.
**The trading range for today is among key support at 96.10, and key resistance at 98.65.
**The general trend over short term basis is to the downside as far as areas of 103.50 remain intact targeting 93.50. USD/JPY S&R" title="USD/JPY S&R" width="628" height="113">
USD/CHF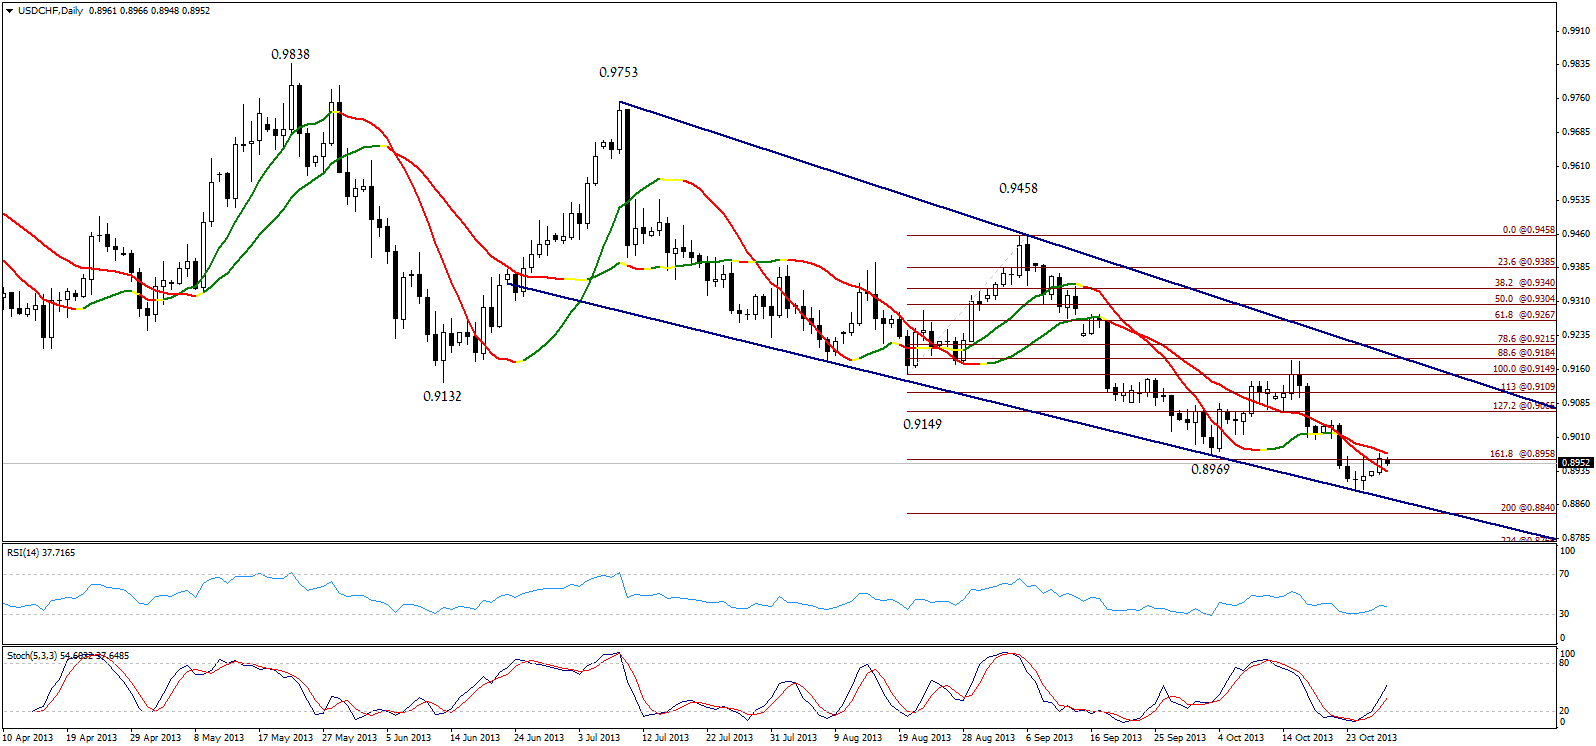 USD/CHF Daily Chart" title="USD/CHF Daily Chart" width="628" height="113">
The pair’s bullish attempt remained limited below 0.8960 yesterday and the pair failed to stabilize above the referred to level. Linear Regression Indicator 55 is also resistance close to 0.8960, as trading below the referred to level keeps the possibility of further bearishness.
**The trading range for today is among key support at 0.8840, and key resistance at 0.9000.
**The general trend over short term basis is to the downside targeting 0.8860 as far as 0.9775 remains intact. USD/CHF S&R" title="USD/CHF S&R" width="628" height="113">
USD/CAD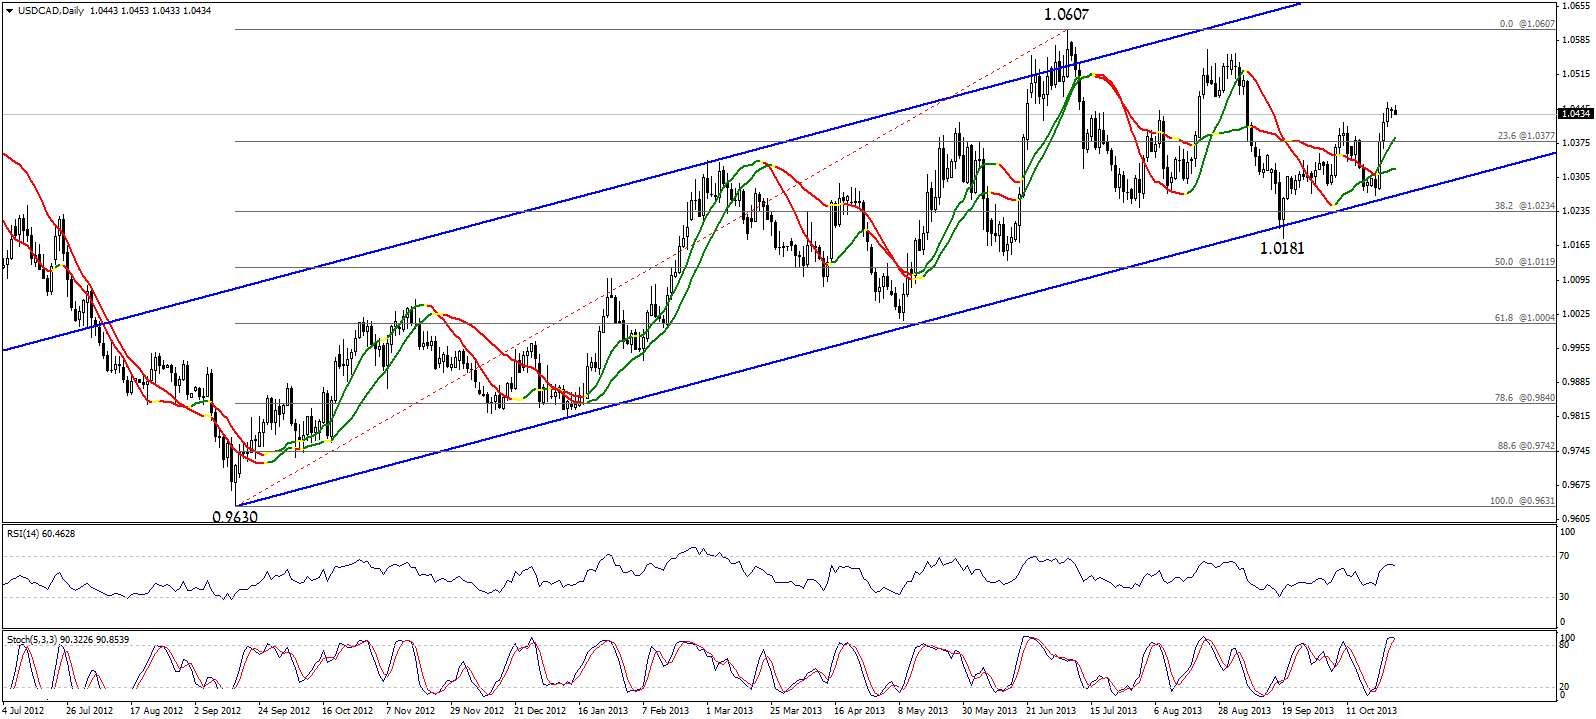 USD/CAD Daily Chart" title="USD/CAD Daily Chart" width="628" height="113">
The pair is experiencing some volatility and bearishness affected by being intraday overbought as shown on Stochastic. Stability above 1.0375 forces to hold on to our positive expectations, whereas trading above the referred to level is positive and could push the pair further to the upside within the ascending channel showing on graph. Linear Regression Indicators support our positive expectations.
**The trading range for today is among key support at 1.0335, and key resistance at 1.0565.
**The general trend over short term basis is to the upside with steady daily closing above 1.0100 targeting 1.0775. USD/CAD S&R" title="USD/CAD S&R" width="628" height="113">
AUD/USD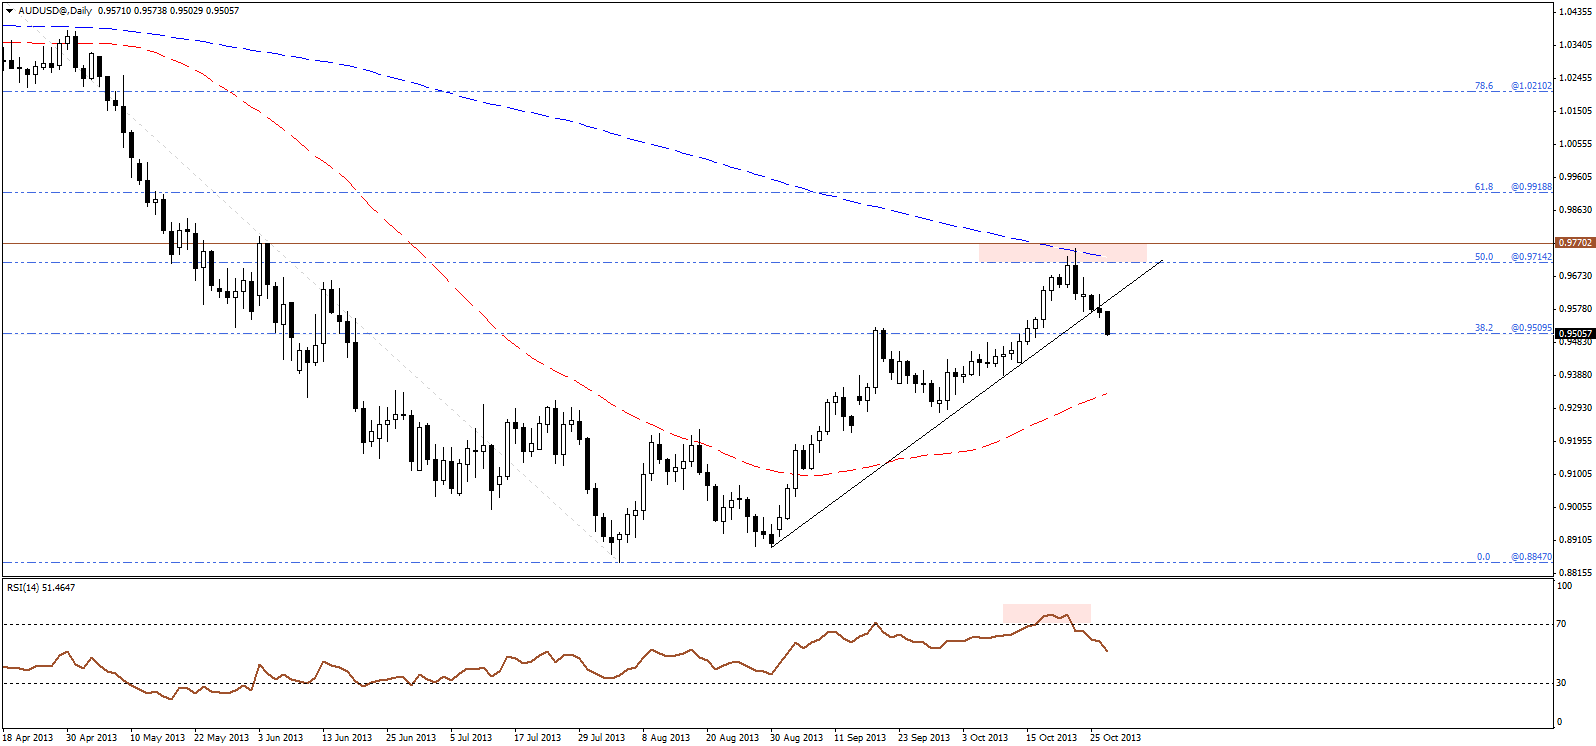 AUD/USD Daily Chart" title="AUD/USD Daily Chart" width="628" height="113">
The pair has broken the main ascending trend line for the bullish wave, heading to retest the previous main swing high around 0.9600, which may form a support for price over intraday basis. However, we look to short upside rebounds from this support as the bearish bias continues to be dominant. AUD/USD S&R" title="AUD/USD S&R" width="628" height="113">
NZD/USD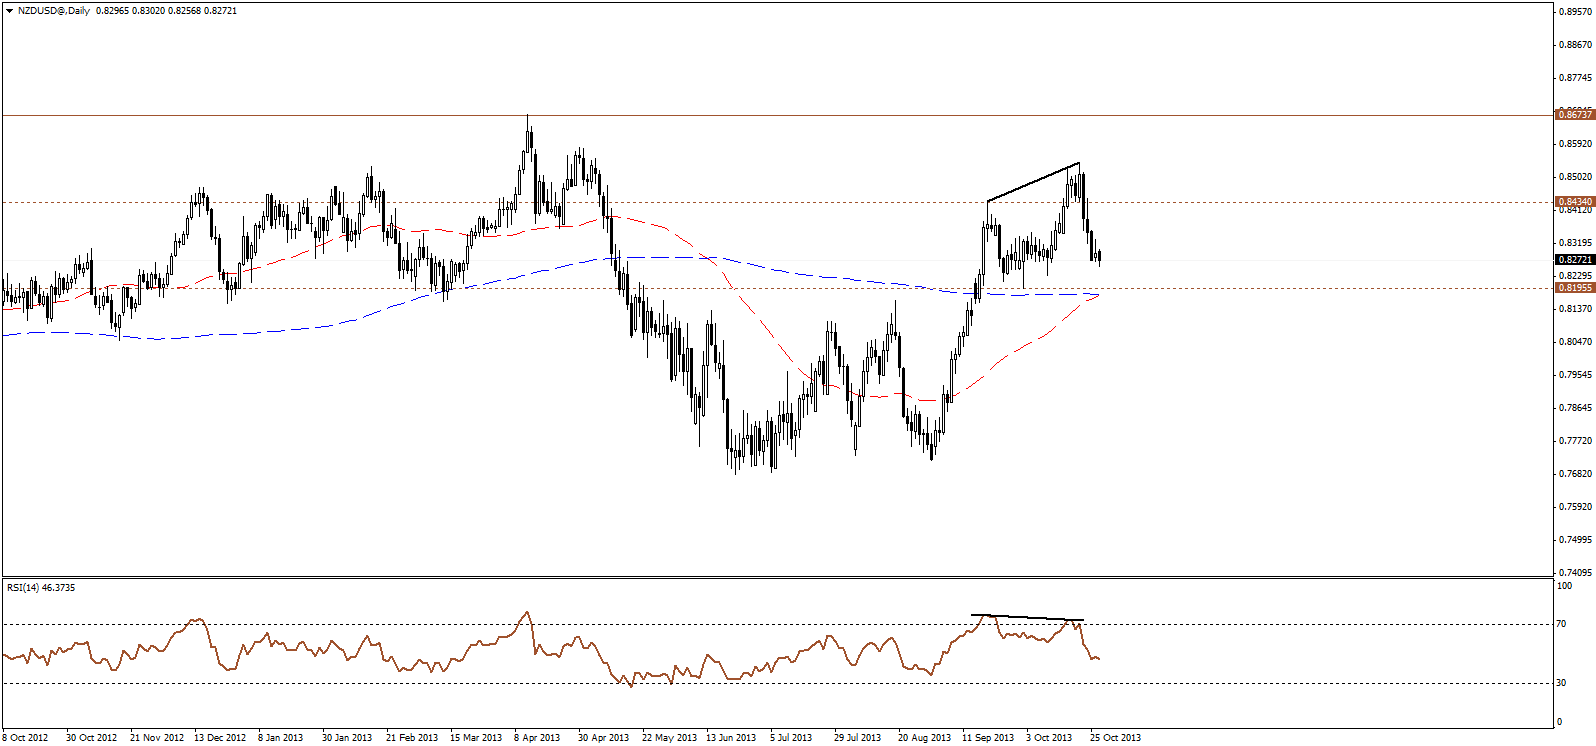 NZD/USD Daily Chart" title="NZD/USD Daily Chart" width="628" height="113">
The pair extends the bearish bias, in an attempt to retest the major support area around 0.8200 level, where the 200 and 50 days SMA reside. Overall, the bearish move may extend further towards the aforementioned area, however due to the strong oversold signals over the lower timeframes we may see some upside correctives move over intraday basis.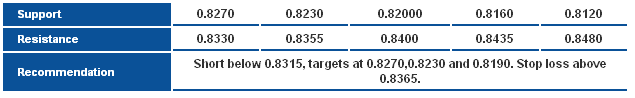 NZD/USD S&R" title="NZD/USD S&R" width="628" height="113">