Get 40% Off
🚀 AI-picked stocks soar in May. PRFT is +55%—in just 16 days! Don’t miss June’s top picks.Unlock full list

Daily FX Technicals: USD/JPY Soars; EUR/USD Moves Sideways

Published 02/01/2016, 06:07 AM
Updated 07/09/2023, 06:31 AM
EUR/USD
-
GBP/USD
-
USD/JPY
-
USD/CHF
-

USD/JPY

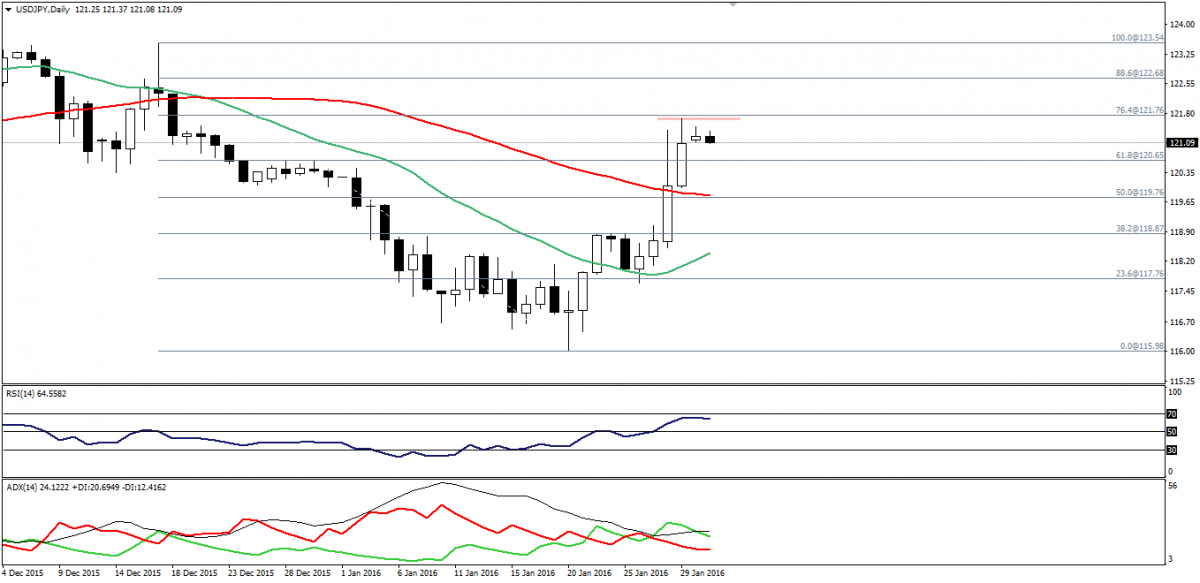
USD/JPY has soared toward the technical targets area we defined on Friday at 121.75, where the 76.4% Fibonacci of the wave seen on the graph exits.
USD/JPY Chart

Being close to this strong resistance offers inappropriate risk versus reward ratio over intraday basis, as it should be cleared to resume the bullish recovery.

On the downside, coming below 120.65 is negative for intraday traders.

Anyway, we will be on the sidelines today to see whether the pair will hit 76.4% level or not.

Support: 120.65-120.50-120.00

Resistance: 121.75-122.10-122.35

Direction: Sideways

USD/CHF

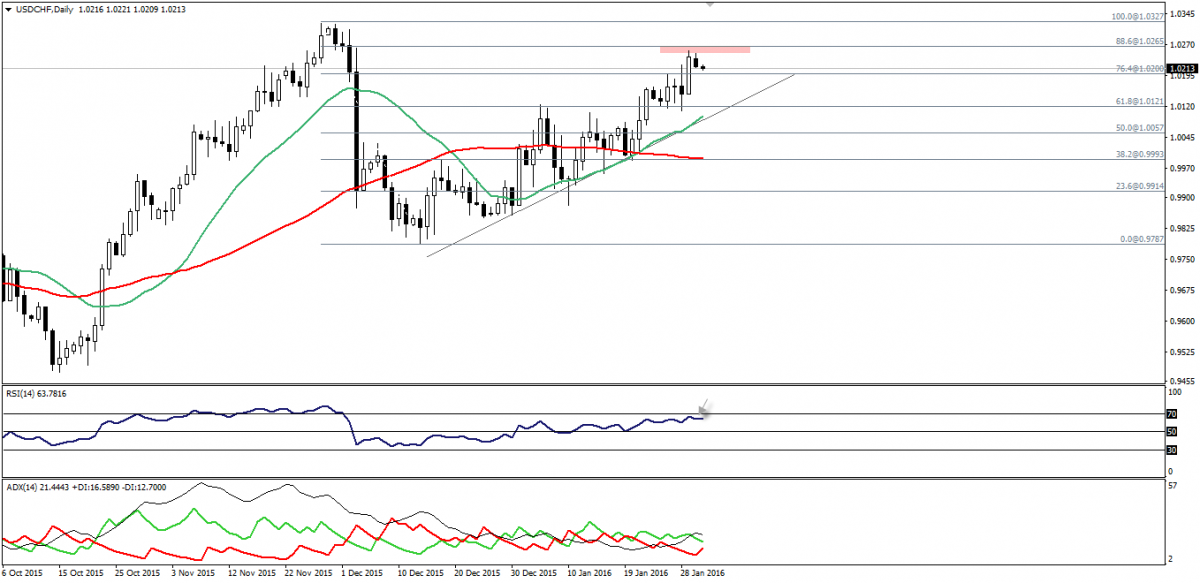
USD/CHF has inched higher on Friday, testing the key levels between 1.0240 and 1.0265 where it started to consolidate due to the sensitivity of these strong resistances.
USD/CHF Chart

During the Asian session didn’t show the ability to breach this level, while RSI becomes very close to overbought areas.

Thus, we believe that, it is better to stand aside to see how the pair will behave between 1.0200 and 1.0265.

Note that Friday’s strong upside actions didn’t assist ADX to be bullish enough to suggest potential positions.

Support: 1.0175-1.0130-1.0110

Resistance: 1.0250-1.0270-1.0320

Direction: Sideways

EUR/USD

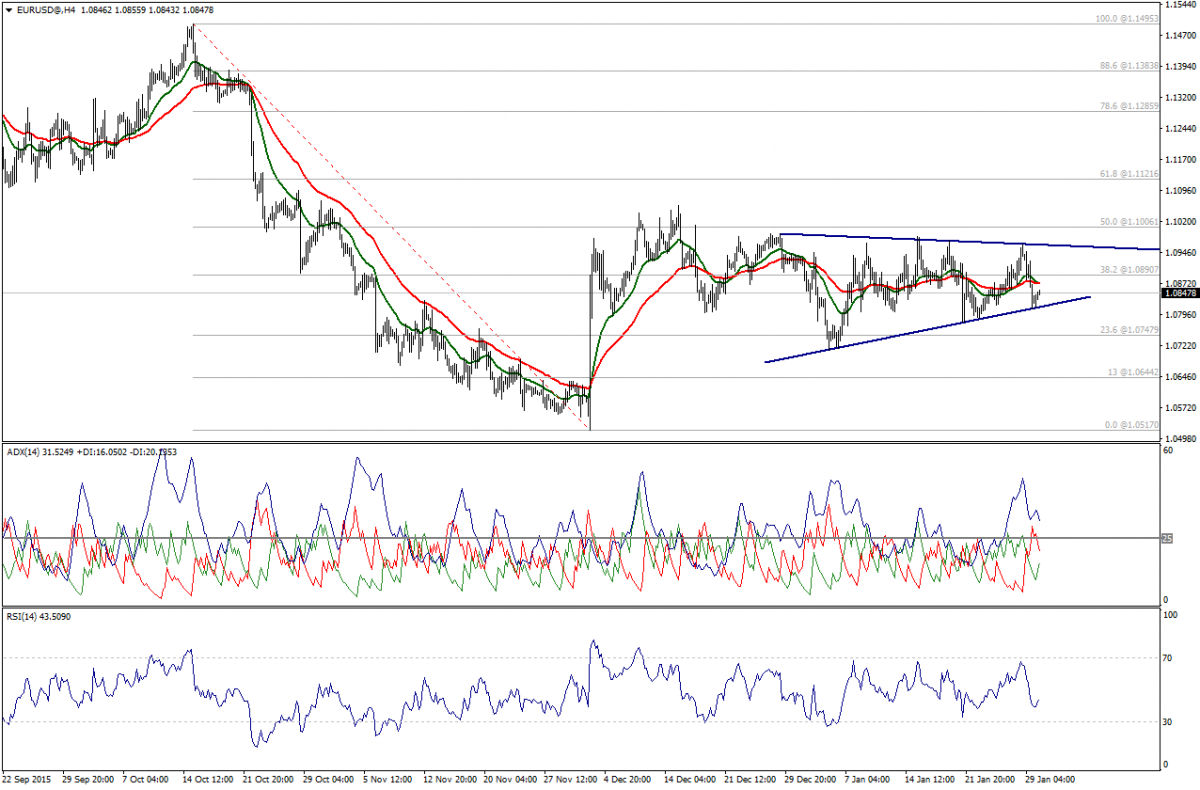
EUR/USD has moved sideways after failing to clear 1.0800 during the Asian session along with moving averages coverage at 1.0875, which is a few pips below 1.0890.
EUR/USD Chart

ADX shows decrease in bears’ power, while no bullish signal appeared. In the interim, RSI moves below 50.00 despite attempting to move higher.

Anyway, we need a break below 1.0800 to suggest bearish actions towards 1.0745.

Support: 1.0835 – 1.0800– 1.0745

Resistance: 1.0890 –1.0935 – 1.0985

Direction: Neutral but bearish below 1.0800

GBP/USD

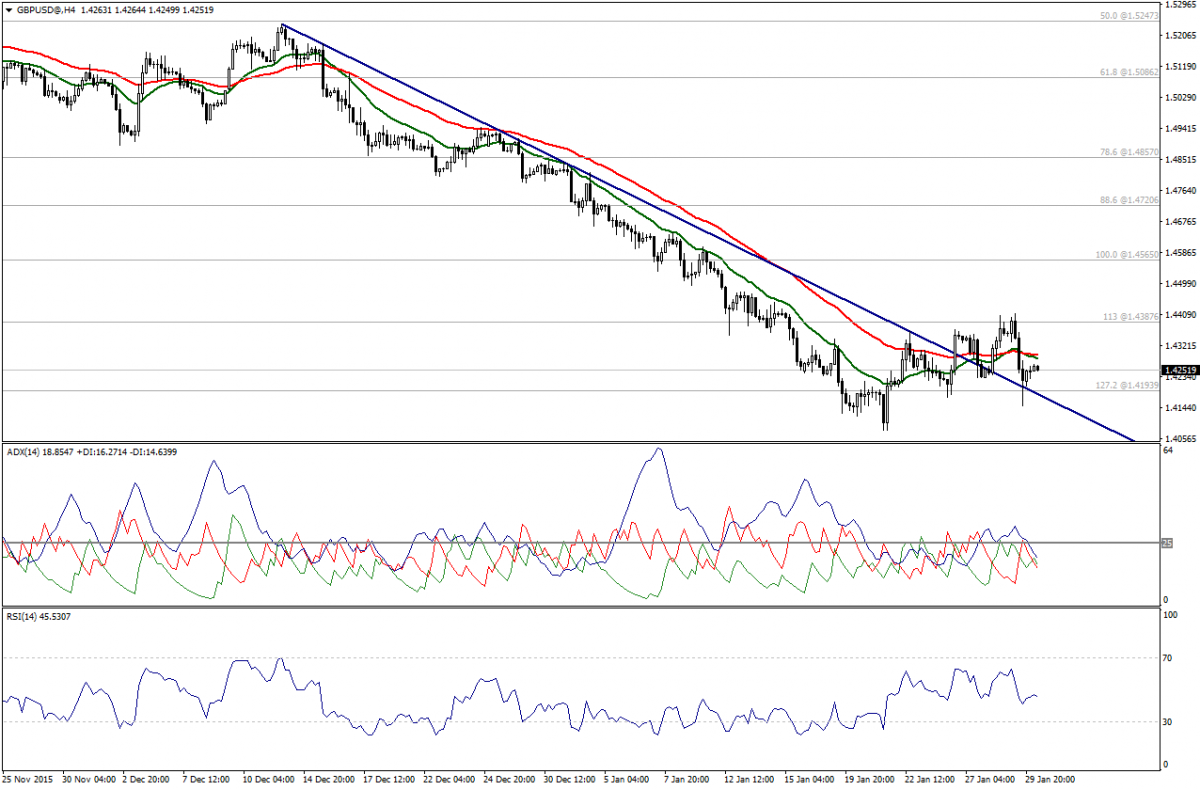
The 4-hour chart shows that prices have moved within a tight range between moving averages from the topside at 1.4295 and 127.2% Fibonacci at 1.4190.
GBP/USD Chart

Trading between those levels is accompanied with weakness on trend indication according to ADX.

RSI moves below 50.00, but it remains neutral and thus, we will be on the sidelines.

Support: 1.4230 – 1.4190 – 1.4100

Resistance: 1.4290 – 1.4325 – 1.4390

Direction: Sdeways

Latest comments

Loading next article…
Risk Disclosure: Trading in financial instruments and/or cryptocurrencies involves high risks including the risk of losing some, or all, of your investment amount, and may not be suitable for all investors. Prices of cryptocurrencies are extremely volatile and may be affected by external factors such as financial, regulatory or political events. Trading on margin increases the financial risks.
Before deciding to trade in financial instrument or cryptocurrencies you should be fully informed of the risks and costs associated with trading the financial markets, carefully consider your investment objectives, level of experience, and risk appetite, and seek professional advice where needed.
Fusion Media would like to remind you that the data contained in this website is not necessarily real-time nor accurate. The data and prices on the website are not necessarily provided by any market or exchange, but may be provided by market makers, and so prices may not be accurate and may differ from the actual price at any given market, meaning prices are indicative and not appropriate for trading purposes. Fusion Media and any provider of the data contained in this website will not accept liability for any loss or damage as a result of your trading, or your reliance on the information contained within this website.
It is prohibited to use, store, reproduce, display, modify, transmit or distribute the data contained in this website without the explicit prior written permission of Fusion Media and/or the data provider. All intellectual property rights are reserved by the providers and/or the exchange providing the data contained in this website.
Fusion Media may be compensated by the advertisers that appear on the website, based on your interaction with the advertisements or advertisers.
© 2007-2024 - Fusion Media Limited. All Rights Reserved.