⌛ Did you miss ProPicks’ 13% gains in May? Subscribe now & catch June’s top AI-picked stocks early.Unlock Stocks

Daily Technical Report: August 6th, 2015

Published 08/06/2015, 04:56 AM
Updated 07/09/2023, 06:31 AM
EUR/USD
-
GBP/USD
-
USD/JPY
-
USD/CHF
-

USD/JPY

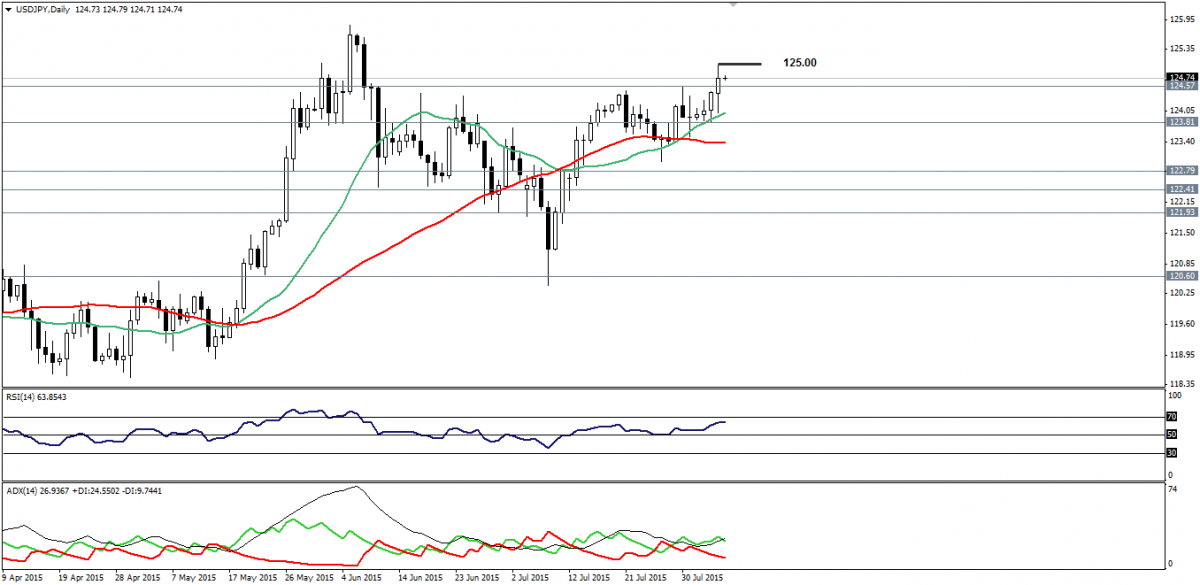
USD/JPY has reached one of our previous suggested technical targets at 125.00 where it met a psychological level.
USD/JPY Daily Chart

The mild retrace from this level makes us neutral over intraday basis despite stability above 124.50 support.

The RSI14 is also approaching overbought levels and that makes us very cautious about trading today.

A break above 125.00 will renew the buying interests with targets at 125.50 and we will update in the proper time.

Support: 124.40-123.80-123.60

Resistance:125.00-125.50-125.80

Direction: Neutral, but bullish above 125.00.

USD/CHF

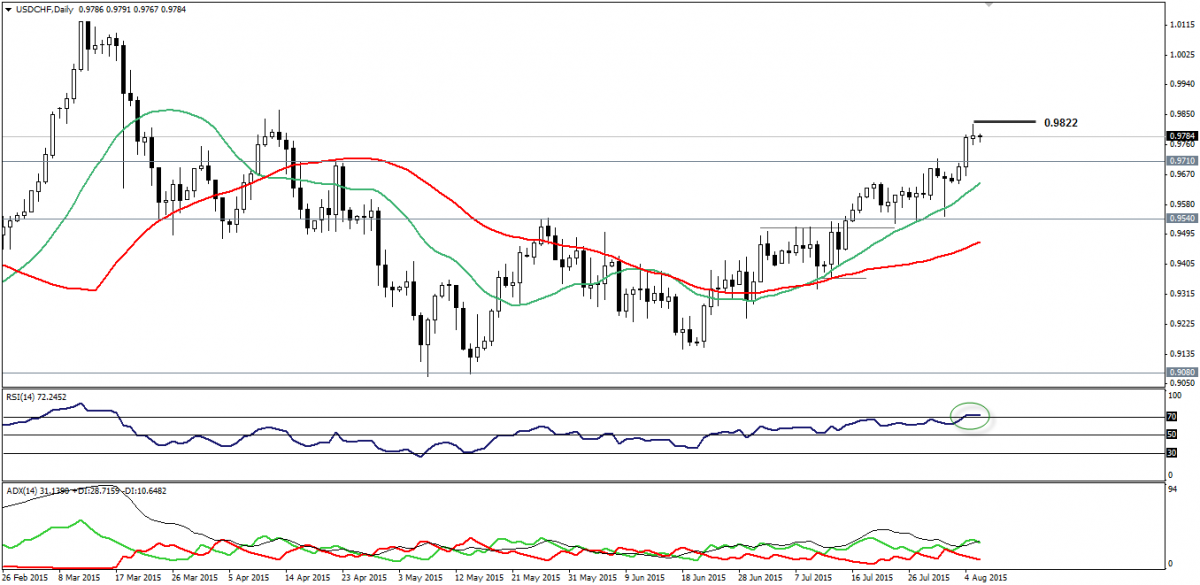
Yesterday, we highlighted the importance of 0.9830 and the pair has moved to the upside approaching this minor resistance.
USD/CHF Daily Chart

The USD/CHF remains stable above moving averages and above the key support levels at 0.9710; however, facing the aforesaid obstacle along with high volatility awaited due to overbought on RSI prevents us from being bullish today.

We will be waiting for a new entry point, as risk versus reward is inappropriate.

Support: 0.9780-0.9750-0.9710

Resistance: 0.9825-0.9860-0.9920

Direction: Sideways

EUR/USD

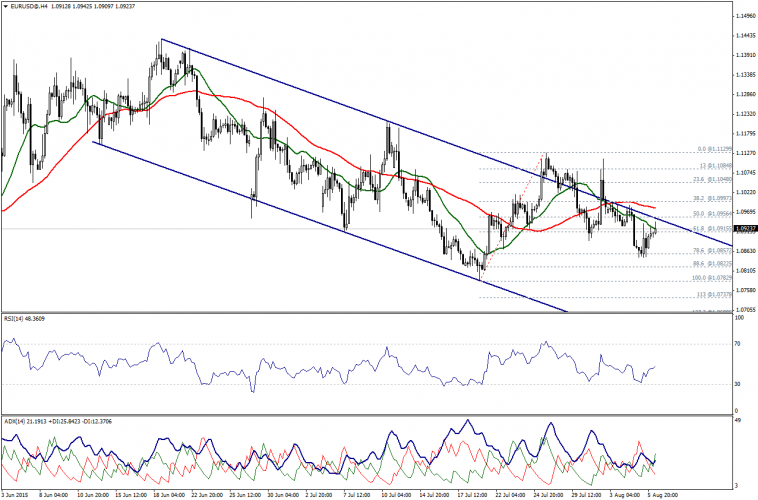
The EUR/USD pair has inclined to areas around 1.0915 , marked by 61.8% Fibonacci. Meanwhile, no confirmation for breaching the bearish channel detected, while moving averages are still negative.
EUR/USD 4-Hour Chart

ADX shows some kind of positivity and that contradicts with trading inside the channel; thereby, we will be neutral today due to inappropriate risk versus reward ratio.

Support: 1.0890 – 1.0820 – 1.0780

Resistance: 1.0955 – 1.1000 – 1.1050

Direction: Sideways

GBP/USD

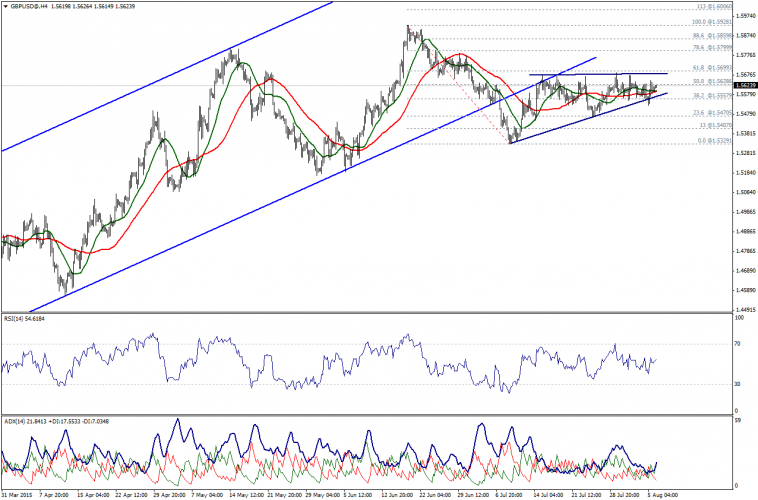
The GBP/USD pair failed to maintain levels below 1.5555 and moved upwards to trade above moving averages, while ADX are turning bullish.
GBP/USD 4-Hour Chart

We need a sustained breakout above the 1.5700 resistance to affirm the bullishness, while coming below 1.5555 is a negative sign.

We will join traders above 1.5700 or below 1.5555, and between these levels we will watch out the market.

Support: 1.5600 – 1.5555 – 1.5500

Resistance: 1.5680 – 1.5700 – 1.5750

Direction: Sideways, but bullish above 1.5700 and bearish below 1.5550.

Latest comments

Loading next article…
Risk Disclosure: Trading in financial instruments and/or cryptocurrencies involves high risks including the risk of losing some, or all, of your investment amount, and may not be suitable for all investors. Prices of cryptocurrencies are extremely volatile and may be affected by external factors such as financial, regulatory or political events. Trading on margin increases the financial risks.
Before deciding to trade in financial instrument or cryptocurrencies you should be fully informed of the risks and costs associated with trading the financial markets, carefully consider your investment objectives, level of experience, and risk appetite, and seek professional advice where needed.
Fusion Media would like to remind you that the data contained in this website is not necessarily real-time nor accurate. The data and prices on the website are not necessarily provided by any market or exchange, but may be provided by market makers, and so prices may not be accurate and may differ from the actual price at any given market, meaning prices are indicative and not appropriate for trading purposes. Fusion Media and any provider of the data contained in this website will not accept liability for any loss or damage as a result of your trading, or your reliance on the information contained within this website.
It is prohibited to use, store, reproduce, display, modify, transmit or distribute the data contained in this website without the explicit prior written permission of Fusion Media and/or the data provider. All intellectual property rights are reserved by the providers and/or the exchange providing the data contained in this website.
Fusion Media may be compensated by the advertisers that appear on the website, based on your interaction with the advertisements or advertisers.
© 2007-2024 - Fusion Media Limited. All Rights Reserved.