EUR/USD - Technical Report
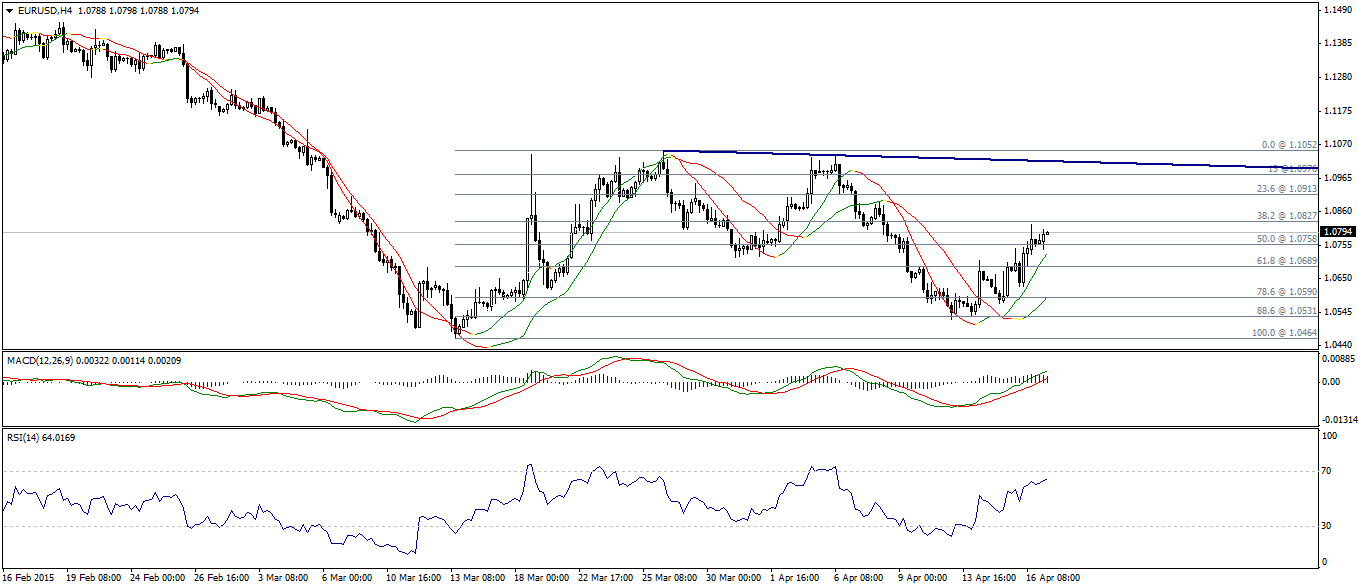
The EURUSD pair rose as expected, and now trading above linear regression indicators and above 50% Fibonacci correction located at 1.0825-1.0830. Breaching 1.0830 will cause another bullish wave targeting 1.0915.
MACD indicator and RSI14 are positive; therefore, there is a high probability of breaching 1.0830. From the down side, breaching 1.0685 will cancel our intraday expectations.

GBP/USD - Technical Report
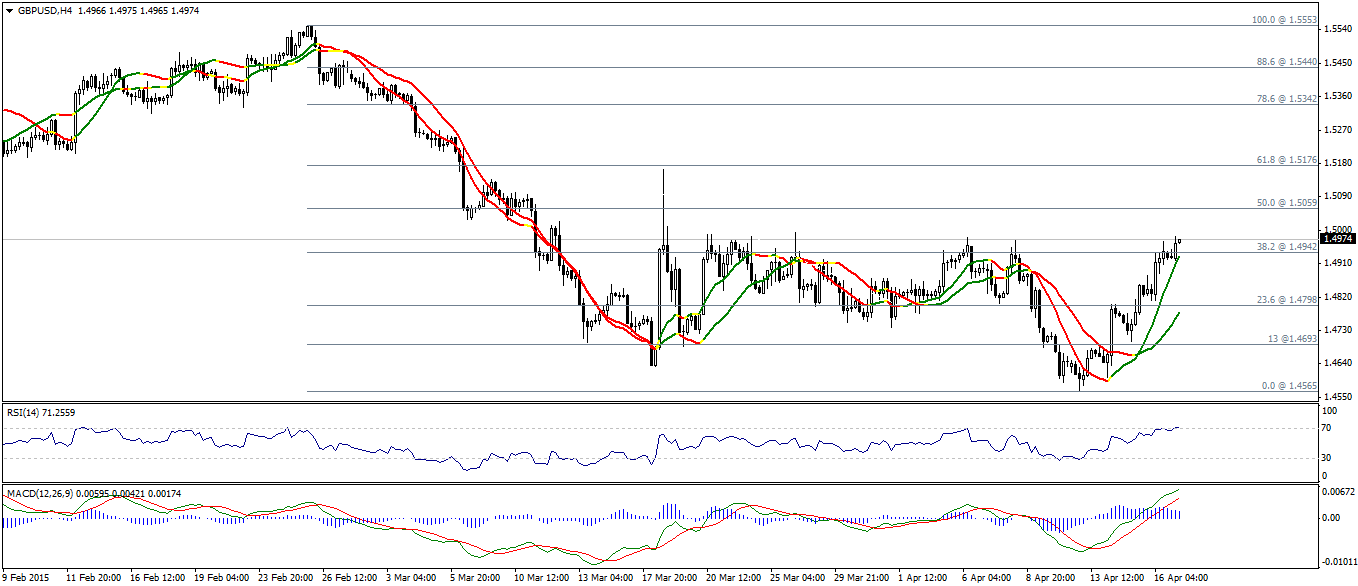
The GBPUSD pair has respected our bullish overview, breaching through 1.4945 regions and that opens the door up towards the new technical objective of the bullish tendencies at 1.5000-1.5060.
Our outlook remains bullish, reinforced by positivity on technical indicators and trading above 1.4830.

USD/JPY - Technical Report
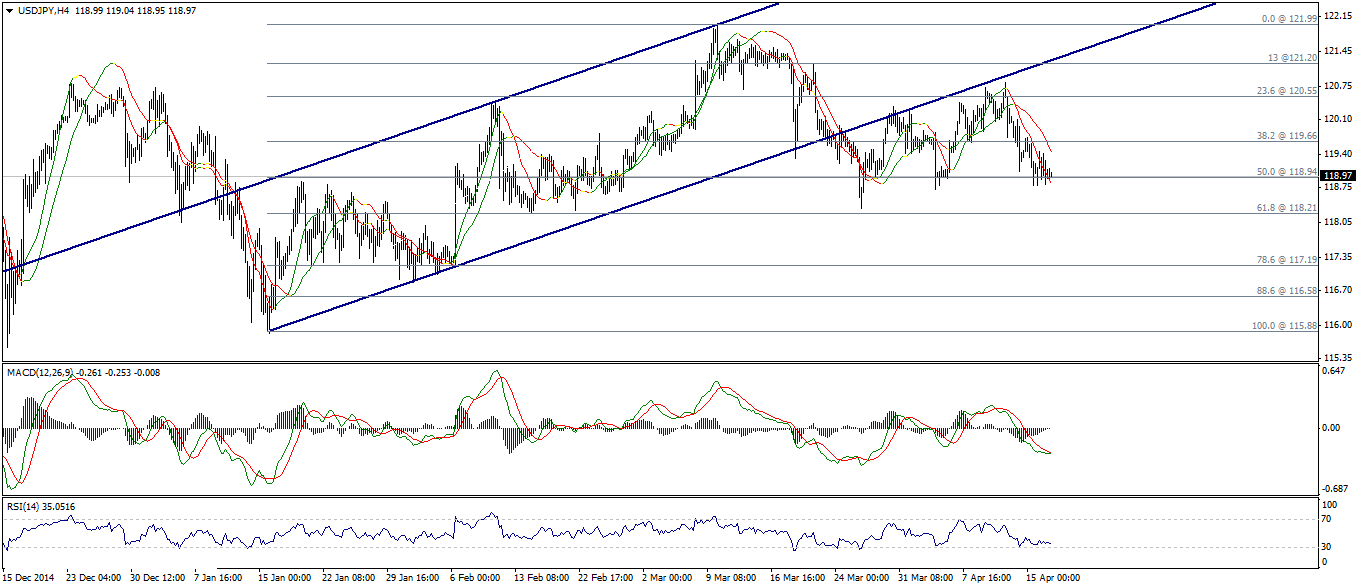
The USDJPY pair could not rise above 38.2% Fibonacci level located at 119.65; therefore, it dropped again to trade just above 50% Fibonacci level located at 118.95. Linear regression indicators are negatively trading, on the other hand, RSI14 is trading in sideways direction near 30.0 support and MACD indicator signal lines trying to achieve positive cross over.
According to the aforesaid facts, we prefer stay neutral today, to see if the pair can achieve a daily closing below 118.95 or not.

USD/CHF - Technical Report
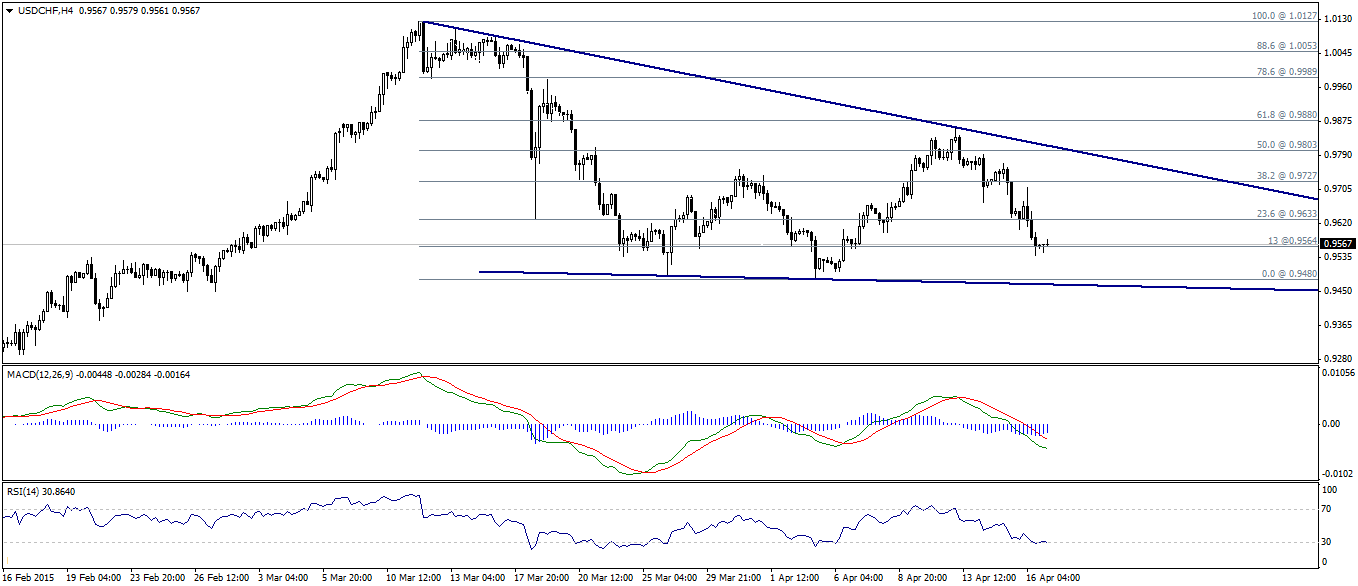
USDCHF pair dropped as expected to trade around 13% correction as we can see on 4H chart shown on the image above. Trading below 0.9635 is bearish, moreover, MACD indicator shows negative signs. Therefore, we expect more bearishness today.
Breaching down 0.9560 level is needed to confirm our expectation, especially with RSI14 trading near 30.0 momentum support.

USD/CAD - Technical Report
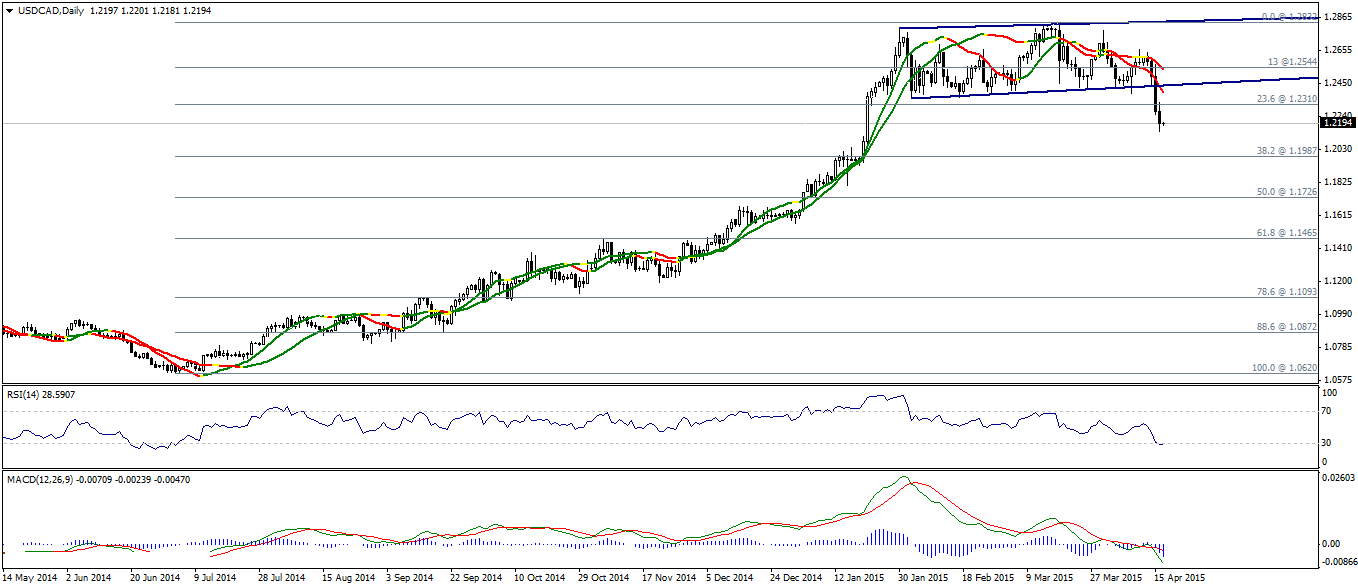
The USDCAD pair continued to drop as expected after breaching the major support previously at 1.2400. We still targeting 38.2% Fibonacci correction located around 1.1990, while trading below 1.2310 will keep the bearishness valid.
MACD indicator shows negative signs, and linear regression indicators are negatively trading.

AUD/USD - Technical Report
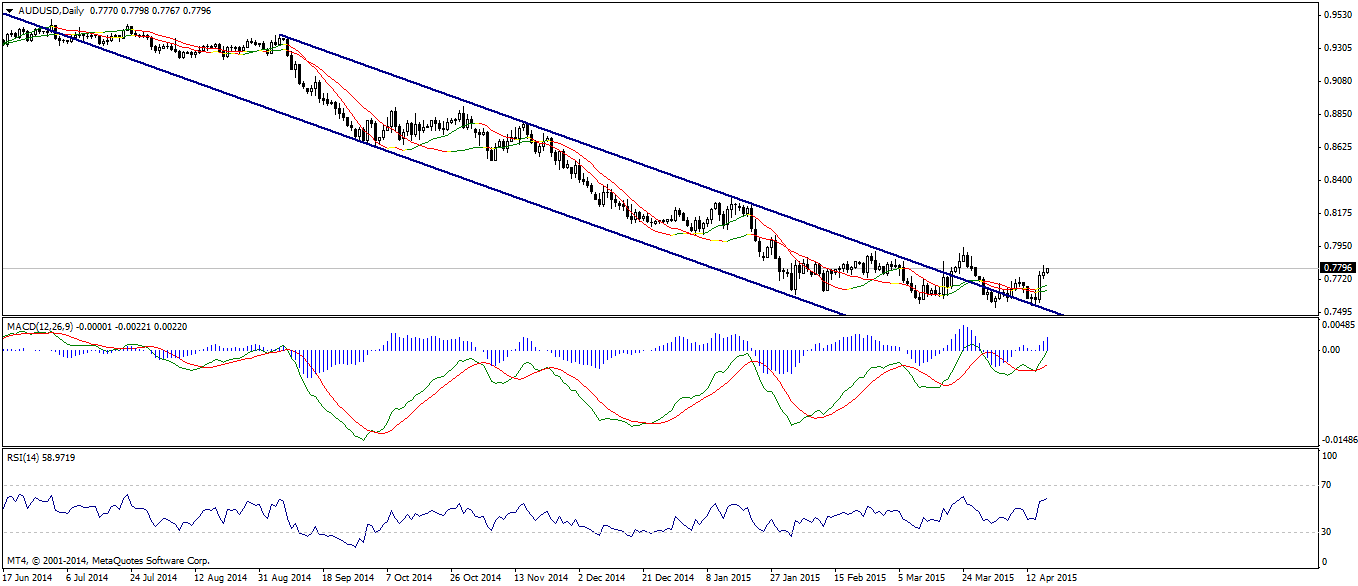
Although the pair traded in a tight range, it rose slightly to the upside to continue trading positively as we expected previously. Trading above 0.7735 considered positive, and may cause more bullishness today.
From the upside, we are targeting 0.7940, which will cause another up wave if the pair breached it.

NZD/USD - Technical Report
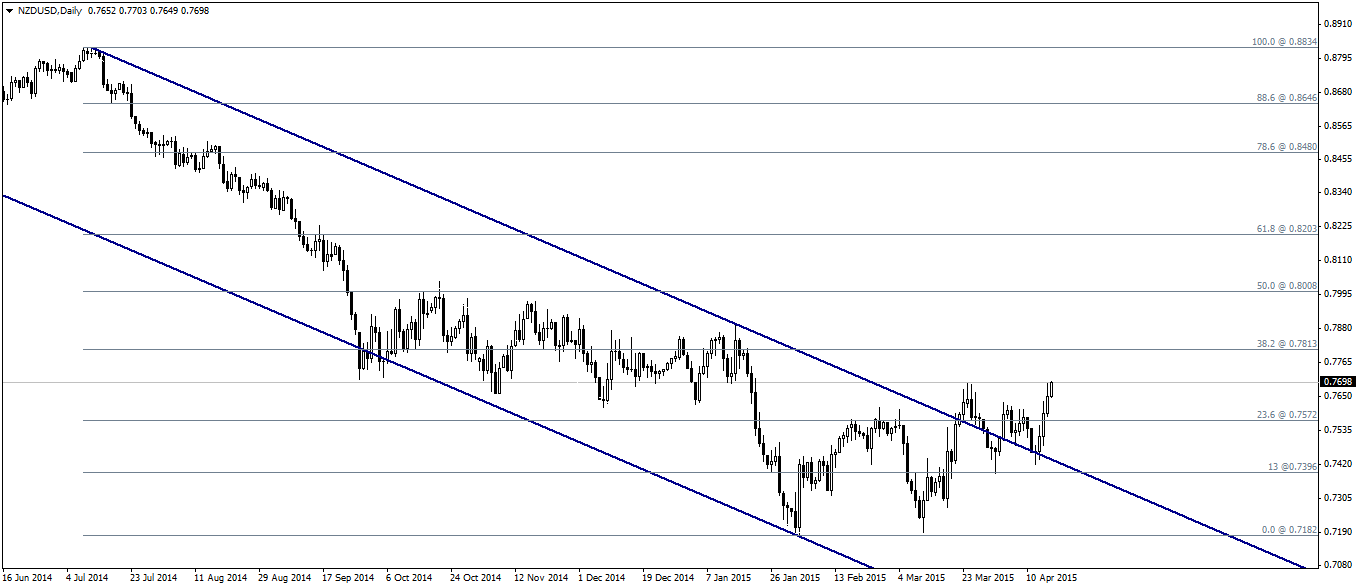
The pair rose again and achieved a daily closing above 0.7640, and that considered positive. Trading above the aforesaid level may cause more bullishness toward 38.2% Fibonacci correction located at 0.7815.
Only breaching down 0.7570 can cancel our bullish expectation, however, we prefer to see the pair trading above 0.7640 to keep a higher probability for bullishness.

