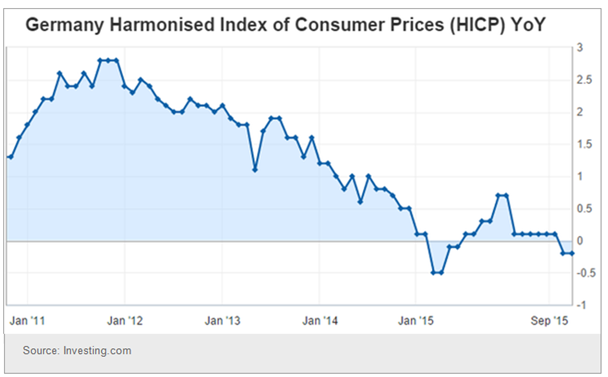
- Germany's HICP ploughing negative territory
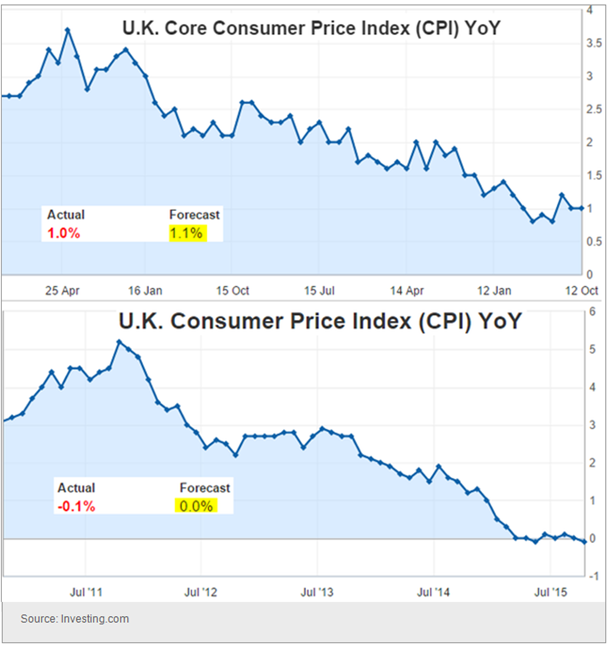
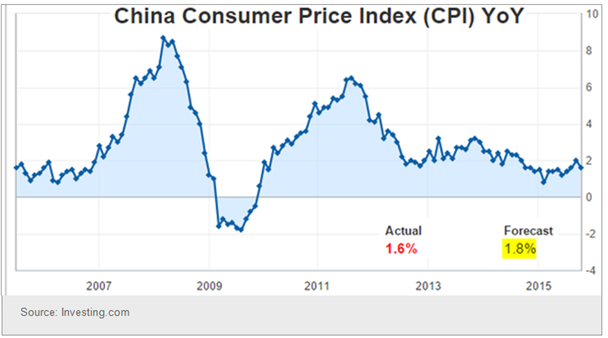
- CPI on the slide in the UK, China and Japan too
- Inflation trends put us miles away from central bank targets
- Cargo freight index heading south in China
- In commodities, strong demand for Opex, weakness for Capex
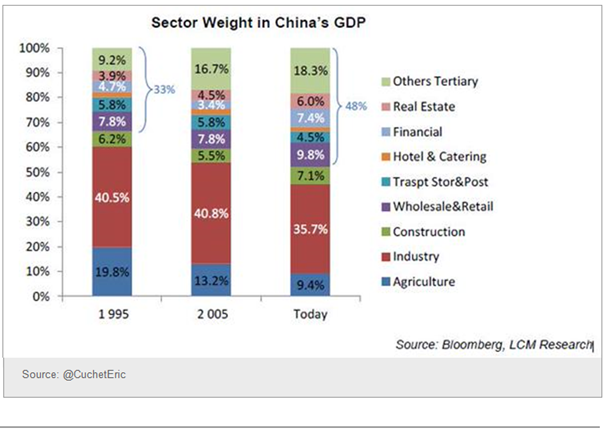
- Industry's contribution to GDP is declining in China
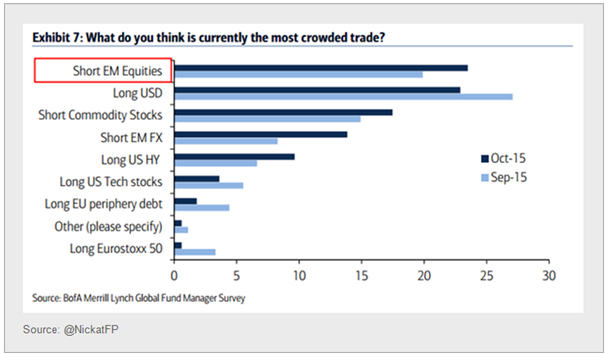
- Short EM equities seems the most overcrowded trade
Let's begin with Tuesday's inflation reports from a number of countries.
1. German HICP remains in negative territory. Yes, much of this is driven by energy, but it should make the European Central Bank uneasy nevertheless. The downwards shock to the headline inflation will be making its way into the "core" numbers in the months to come.
2. Consumer inflation in the UK came in below forecasts, sending the pound lower. Rate hike expectations in the UK got pushed out again.
3. China's CPI came in below forecasts as well as pork prices eased.
4. In Japan producer prices declined the most (YoY) since 2009.
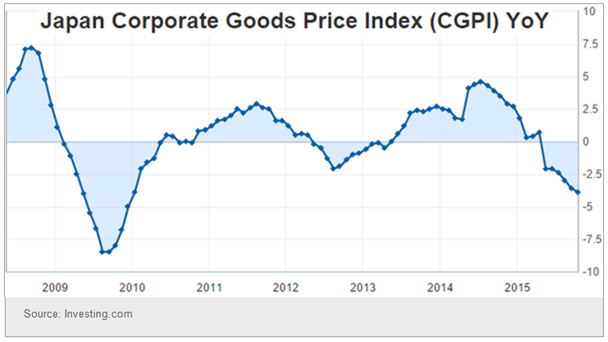
Assuming energy prices stabilise, we should start seeing these inflation measures bottoming out in the next few months. However, it will be some time before we are anywhere near the targets set by central bankers.
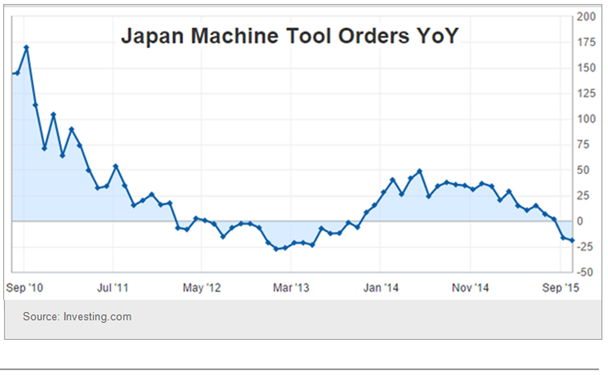
Continuing with Japan, the economic data there remains mixed. The latest machine tool orders, an indicator of industrial demand, keep declining.
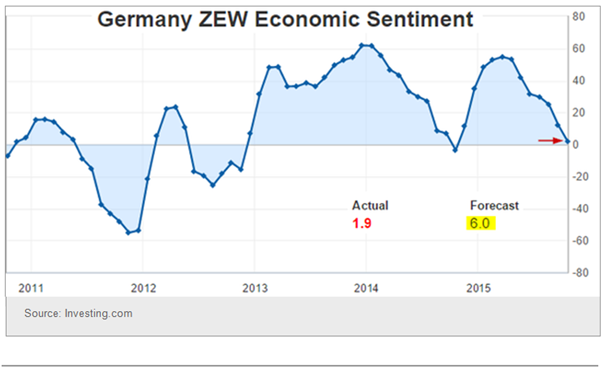
In the Eurozone we see the ZEW German economic sentiment index trending lower, with the latest result worse than consensus. Is the recent market volatility taking its toll? Will the VW (OTC:VLKPY) mess put further pressure on sentiment?
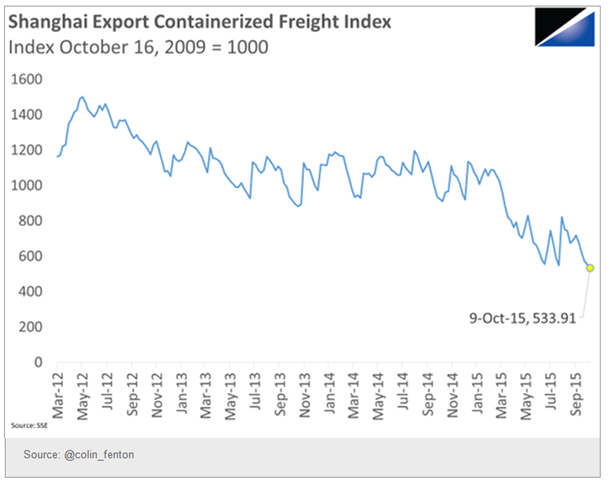
In a follow-up to yesterday's discussion on China, here is more data supporting the economic rebalancing hypothesis. 1. This cargo freight index shows an ongoing weakening in traditional export activity.
2. The chart below from Goldman (N:GS) shows the demand picking up for Opex commodities (stuff needed to operate businesses) and declining for Capex commodities (stuff used to build factories, buildings, etc.). 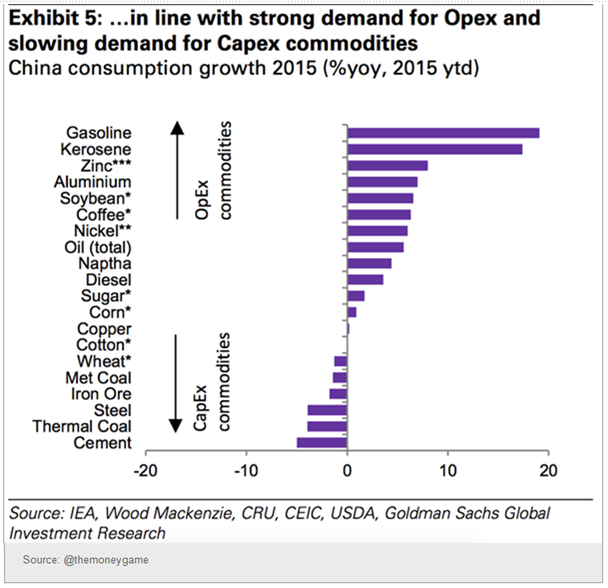
3. Finally, this longer-term chart demonstrates the decreasing impact of industry on GDP.
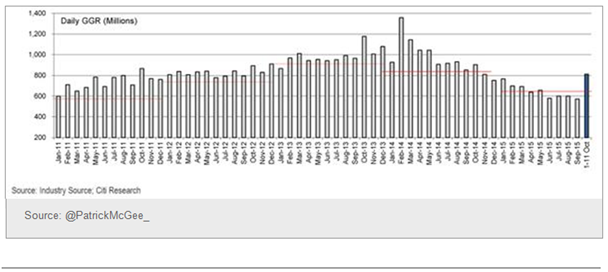
By the way, with the stock market "gambling" in China no longer attractive, gamblers return to Macau. Citi is projecting an increase in revenues.
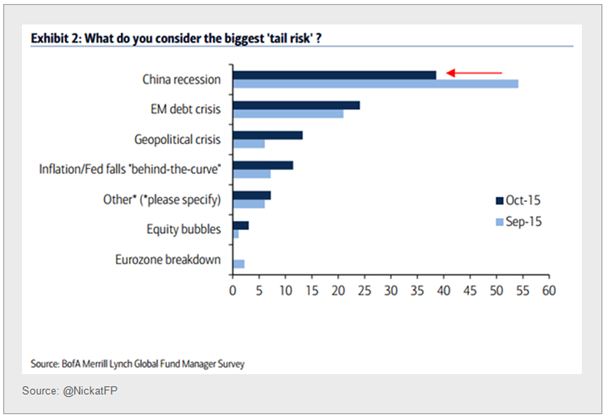
Now let's look at some interesting results from the latest BAML Global Fund Manager Survey (thanks to @NickatFP). 1. The perceived risk of "China recession" is elevated but seems to be subsiding.
2. Short positions in emerging market equities and currencies are increasingly viewed as a crowded trade.
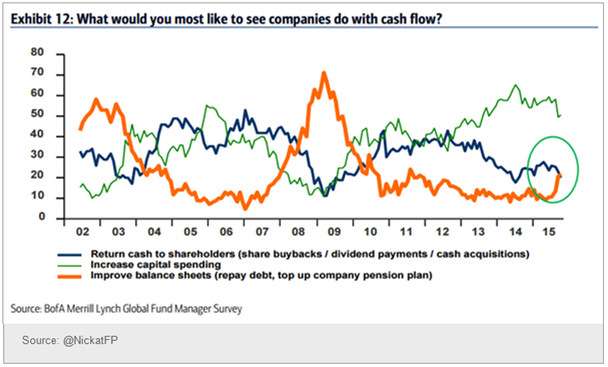
3. A rising number of investors wants companies to delever rather than undertake CAPEX or return cash.
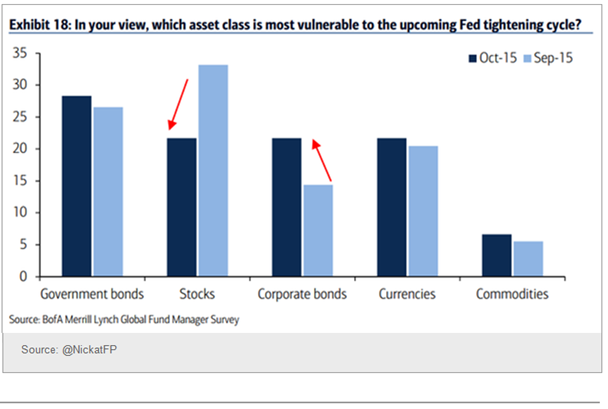
4. Investors shifted their view of which assets are most vulnerable to the Fed's tightening cycle.
Disclosure: Originally published at Saxo Bank TradingFloor.com
