
EUR/USD
Perhaps the most interesting technical event, albeit minor in magnitude was the fact that the weekly pivot rejected the price in an attempt to dip lower. As announced yesterday this level underpinned the rate and offered a short-term scalp opportunity. This price action left a hammer like candlestick pattern contrasting with the two spinning tops we have been adverting about, shifting the message from hesitation to potential bullish. Adding credence to this view, the triangular consolidation seen on intraday charts morphed into a large pennant continuation pattern. But attention: the more sideways the pair moves during the day, the less effective the pattern will result. An equal length of magnitude between the vertical advance and the lateral consolidation usually results in a inverted “U” pattern, which would bring the pair back to the 1.3740s.
Resistance: 1.3911; 1.3932; 1.4150; 1.4258
Support: 1.3832; 1.3800; 1.3750; 1.3700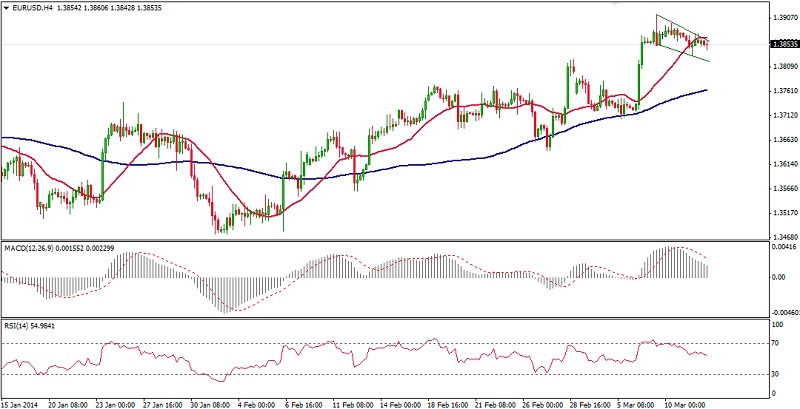 EUR/USD Hourly Chart" title="EUR/USD Hourly Chart" width="800" height="449">
EUR/JPY
The support trend line from last week's low catched up with the sideways moving price and was silently cleared to the downside offering not technical cushion whatsoever to start a new leg to the upside. Considering that we have recovered 61,8% of the January plunge and that buying appears to dry up, the EURJPY has scope to reverse the intermediate trend and reverse lower anew. Visible on the 4-hour chart is a Fibonacci scale showing the bulk of trading between the 38,2% and 61,8% an possible target in case of a depreciation in the cross. Upside resistances looming are the December high around 145.60, well above 200 pips from now but with little obstacles on the way. Above that level, an impressive wall is visible on a monthly chart offering an open invitation to a 2000 pips escalation in this yen cross. So abandon your short-view in case of piercing above these resistances as this may indicate higher attempt at 145.00 – 155.00 regions.
Resistance: 144.50; 145.00; 145.60; 151.00
Support: 142.09; 141.50; 140.00; 139.08 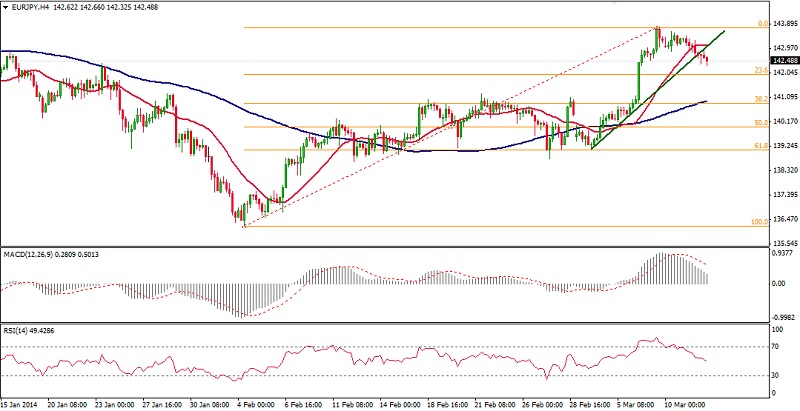 EUR/JPY Hourly Chart" title="EUR/JPY Hourly Chart" width="800" height="449">
GBP/USD
The almost vertical session on Monday was followed by a small sideways consolidation, which had the potential to become a short-term continuation flag pattern if broken down. Since this was not the case, the risk is now for cable to recapture the 1.6730 level, upper boundary of the major sideways trend. In lockstep with the potential downward reversal in the EUR/USD, the odds increase for a price deterioration in the EUR/GBP cross. Intraday oscillators find themselves below its center lines and leaving the oversold areas seen as a result of the down drift on Monday. If positive readings get rejected, additional weakness is likely to become the tone for the rest of the week. On the way South, at 1.6450 we could start seeing interest to participate in buying corrective dips.
Resistance: 1.6650; 1.6712; 1.6792; 1.6840
Support: 1.6582;L 1.6548; 1.6474; 1.6390 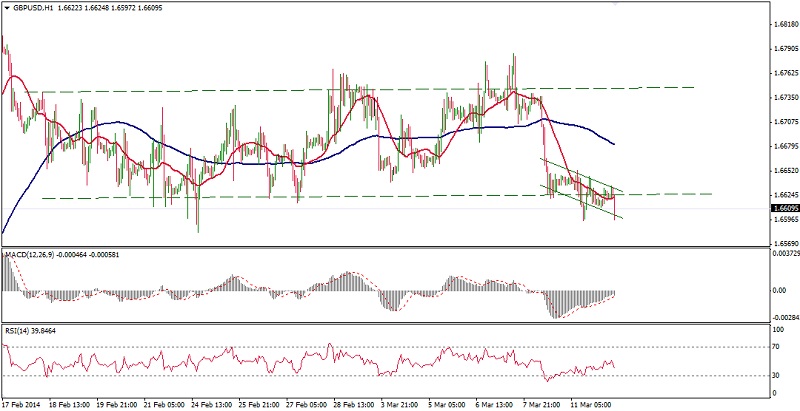 GBP/USD Hour Chart" title="GBP/USD Hour Chart" width="800" height="449">
USD/JPY
The Bank of Japan maintained record easing, but the marginal gains seen overnight against the dollar are mostly attributed to the demand for safety as stocks and commodities also fell amid concern about instability in China’s financial system. Still locked within the range of last week's NFP-induced 1-hour candlestick, the USDJ/PY has been hesitating on which side to break through. The most important technical event from yesterday was a direct loss of the round number 103.00 which can be inferred as this whole spike high affair has been a false upside break with a possible return below 102.50. The four small-bodied candlesticks looming on the daily chart are indicative of an abated momentum and also add credence for a turn in the tide. Presently speaking, the USDJPY is reaching the weekly pivot (102.73) anew. Would the pair manage to regain the 103.00 figure, then the 104.00 and 104.50 handles could be reached quite easily since there are not many obstacles on the way North.
Resistance: 103.08; 103.32; 103.66; 103.90
Support: 102.73; 102.50; 102.00; 101.15 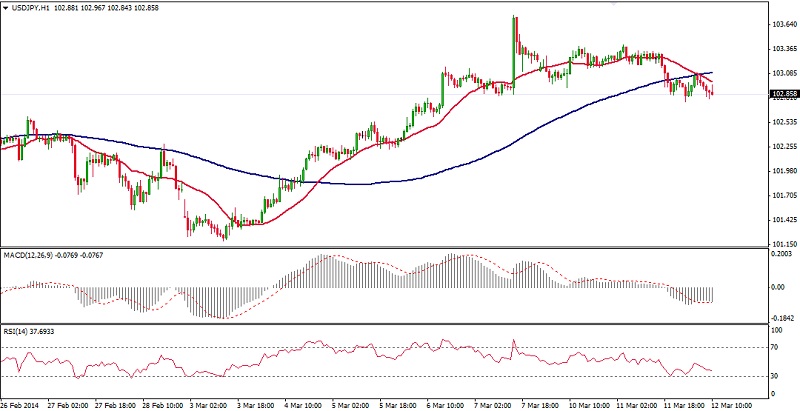 USD/JPY Hour Chart" title="USD/JPY Hour Chart" width="800" height="449">
AUD/USD
Demand for the Aussie dried momentarily on the concern China's economy is slowing and that more bond defaults will follow and collapsed to 6 week trend line support. The pair managed to erode the technical cushion offered by the 61.8% retracement from the 0.9130 peak (@0.8980) and opened the scope to test the bulls at the start of the rally at 0.8890. While the AUD/USD is at risk for breaking an uptrend support line where it currently sits, bulls could keep the bears on their toes and manifest a buying interest at current levels. Let’s not forget how the Aussie responded with strong gains against the US dollar following sharp-looking Australian economic releases last week.
Resistance: 0.9000; 0.9050; 0.9080; 0.9102;
Support: 0.8950; 0.8890; 0.8760; 0.8680 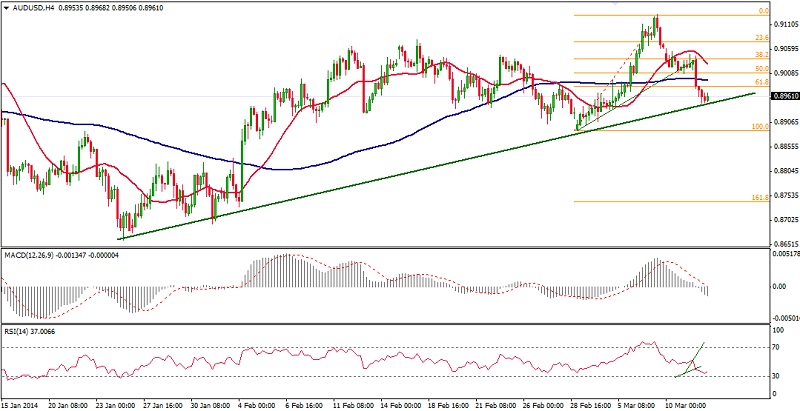 AUD/USD Hour Chart" title="AUD/USD Hour Chart" width="800" height="449">
AUD/NZD
Australia's currency touched a six-week low versus its New Zealand counterpart as economists are certain that unlike Australia -which is struggling at the moment and unlikely to lift rates anytime soon- the smaller nation's central bank will raise interest rates. On the technical front, the Pacific cross now eyes 1.0550 with scope of further weakness towards 1.0480, a Fibonacci 161.8% extension of the more pronounced down move from two weeks ago. But only a break of the January low would mean the prevailing trend – as seen in the daily charts- is still operative. The reaction from these lows still threatens to turn the tide and conquer higher levels. A correction in NZD based pairs, many of them overextended to some degree, would favour a rally in the AUDNZD cross. This could happen since the impact of the interest rates hike has already been priced in for a lot of market makers and traders, who would take profits if reality corresponds to their expectations. As a reaction to the announcement, a jump in the NZDUSD is likely but it's unlikely to be sustained.
Res 1.0606; 1.0635; 1.0690; 1.0750
Support: 1.0500; 1.0528; 1.0480; 1.0242 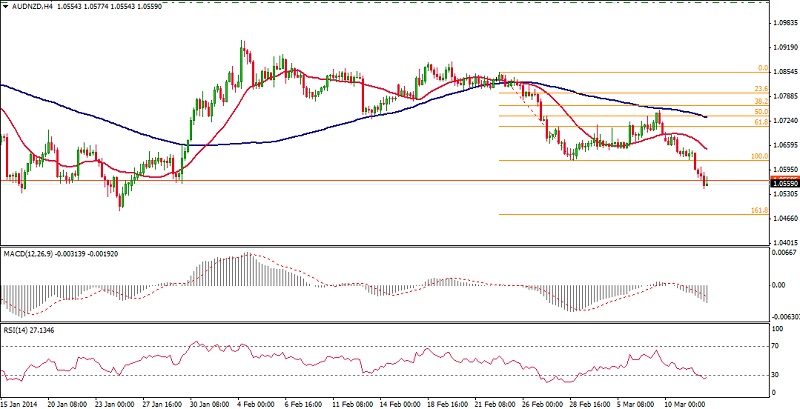 AUD/NZD Hour Chart" title="AUD/NZD Hour Chart" width="800" height="449">
XAU/USD
While other commodities like copper, silver, and crude oil are tanking, the underpin for Gold's rise this year is geopolitical problems. Recent shocking Chinese data also helped to increase the appetite for safe haven assets. With this risk aversion sentiment extension to the yesterday's session, gold managed to clear the 1350 upside mark en route to the August's plateau at the round number 1400. Yesterday's most meaningful technical event was the invalidation of a potential double top formation seen on intraweek charts which needed confirmation with a break of 1330. This pattern failure contributed to skew the probabilities to another rally in the price of gold. On the other hand, the daily charts show a struggling rise with decreased momentum on the MACD. Add to this a triple bearish divergence with the higher highs seen in the price action against lower highs in the RSI(14), and conditions become ripe for a reversal.
Resistance: 1365; 1377; 1400; 1420
Support: 1352; 1327; 1315; 1302; 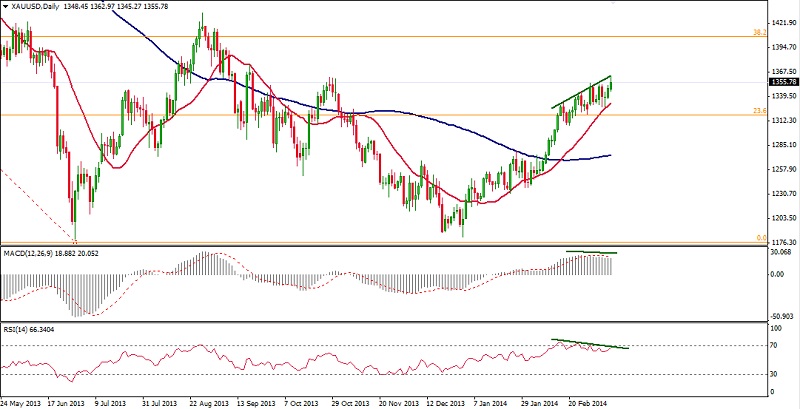 XAU/USD Hour Chart" title="XAU/USD Hour Chart" width="800" height="449">