Dollar Pushes Down To 3 Month Low

Published 05/14/2015, 12:48 AM
Updated 05/14/2017, 06:45 AM
GBP/USD
-
NZD/USD
-
DX
-
GC
-

Taking a look at the US dollar first up, it had another day to forget as it pushed down to a three month low. Weaker than expected retail sales figures were the main culprit for the dollar sell-off as core retail sales came in well short of the 0.5% the market expected, at just 0.1% month on month. This is another example of weakening economic data out of the US that will make the US Federal reserve’s job difficult in deciding when to raise interest rates.

S: 93.486, R:95.330
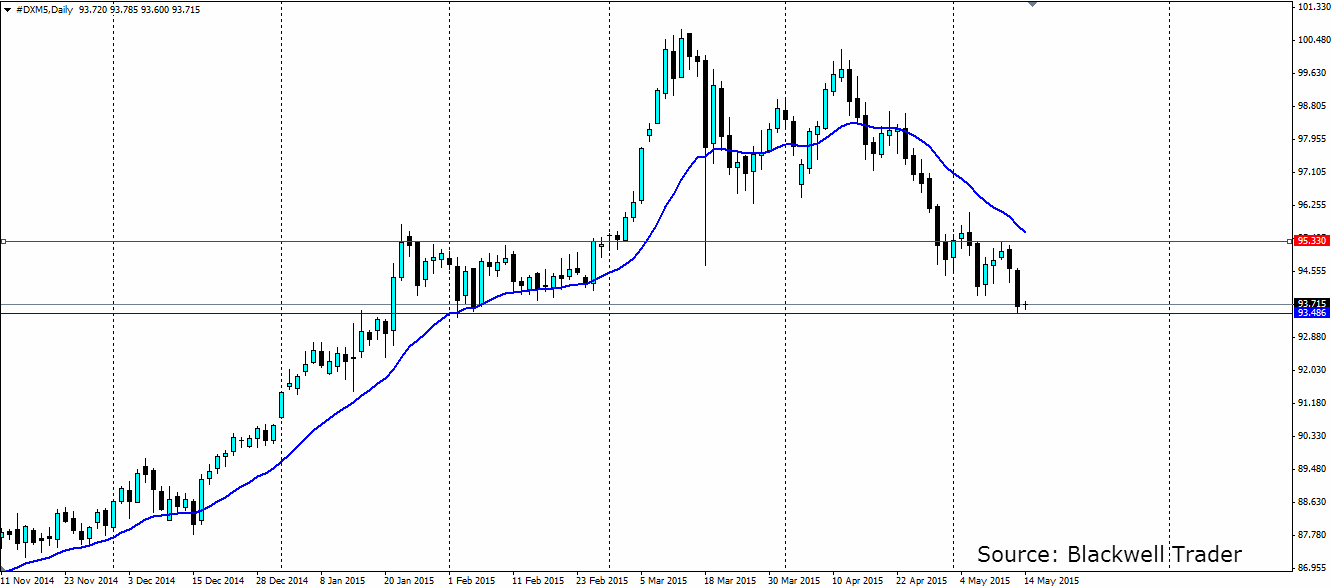
USD Daily Chart November 2014-May 2015

Looking at the cable now, it charged higher once again marking 23 days in the green out of the last 27. It has now retraced all of the losses from the beginning of 2015 and hit a high not seen since the 16th of December last year. The UK Unemployment rate fell from 5.5% to 5.4% and US dollar weakness helped the pair. The Bank of England downgraded its 2015 growth forecast from 2.9% to 2.5% but this was not enough to dampen the buying.

S: 1.5587, R: 1.5781
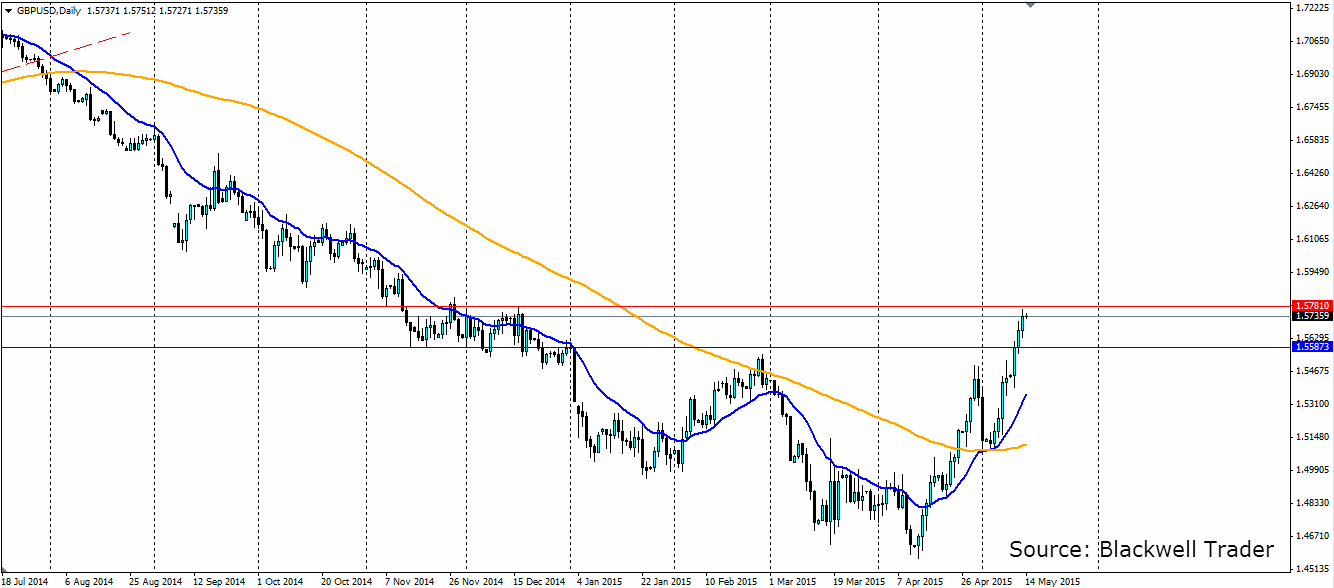
GBP/USD Daily Chart July 2014-May 2015

Taking a look at gold now, it pushed up out of the recent bearish trend to post a one month high. The precious metal was in demand as the US dollar weakened and the soft retail sales figures led to safe haven buying. If the US economy continues to slow down, we could see a solid push higher in the gold market as investors look for somewhere safe to put their money.

S: 1197.91, R:1219.69
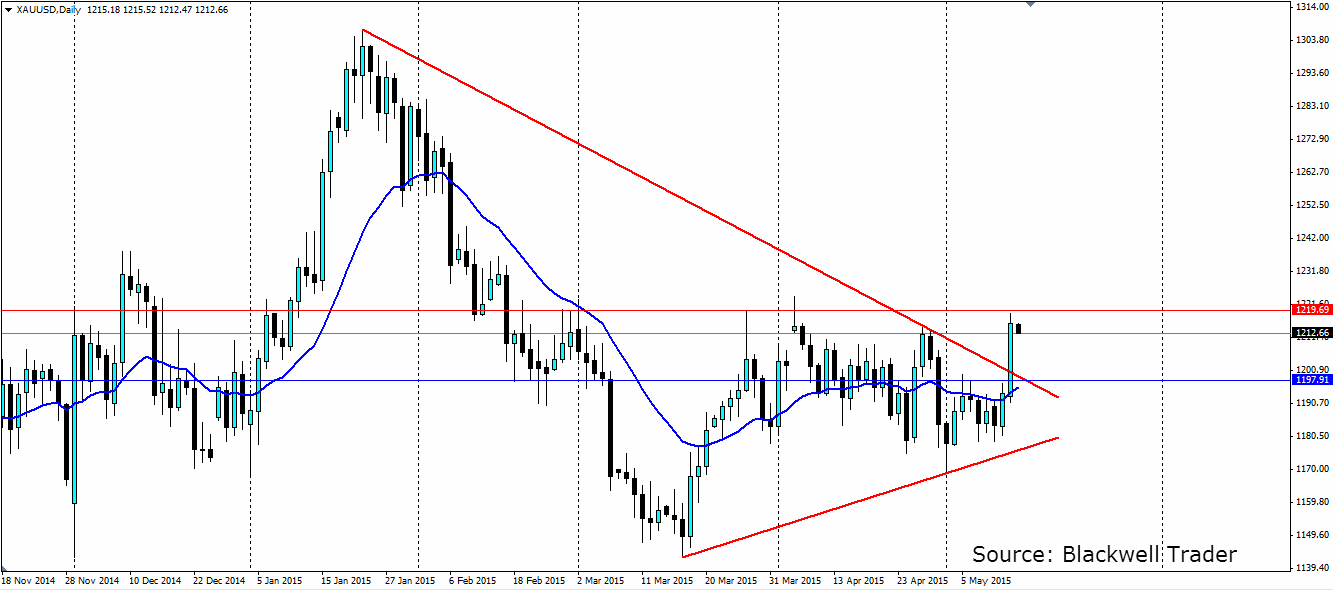
Gold Daily Chart November 2014-May 2015

And finally today, the kiwi has found plenty of bullish support this morning thanks to stronger than expected retail sales figures. New Zealand Core retail sales lifted from 1.5% to 2.9% quarter on quarter in a sign that the domestic market is still relatively strong, despite weakening commodity prices and a lift in the unemployment rate. This may take some pressure off the RBNZ to cut rates, so we could see the bullish sentiment in the kiwi dollar continue.

S: 0.7591, R: 0.7505
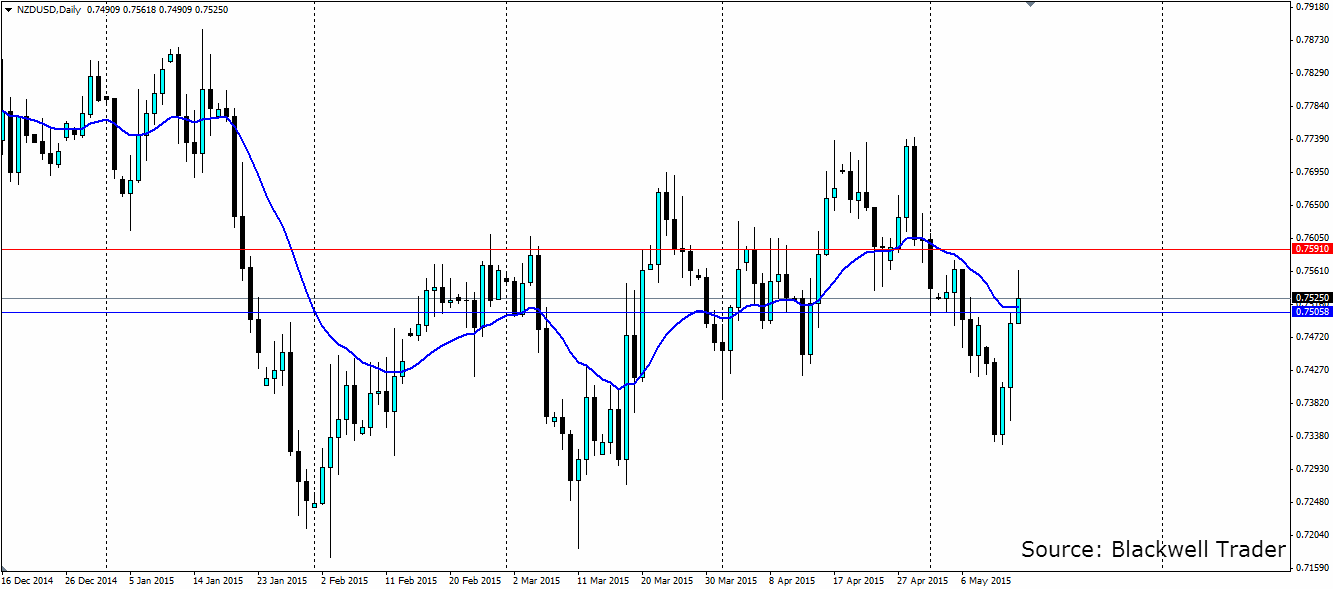
Kiwi Daily Chart December 2014-May 2015

Latest comments

Loading next article…
Risk Disclosure: Trading in financial instruments and/or cryptocurrencies involves high risks including the risk of losing some, or all, of your investment amount, and may not be suitable for all investors. Prices of cryptocurrencies are extremely volatile and may be affected by external factors such as financial, regulatory or political events. Trading on margin increases the financial risks.
Before deciding to trade in financial instrument or cryptocurrencies you should be fully informed of the risks and costs associated with trading the financial markets, carefully consider your investment objectives, level of experience, and risk appetite, and seek professional advice where needed.
Fusion Media would like to remind you that the data contained in this website is not necessarily real-time nor accurate. The data and prices on the website are not necessarily provided by any market or exchange, but may be provided by market makers, and so prices may not be accurate and may differ from the actual price at any given market, meaning prices are indicative and not appropriate for trading purposes. Fusion Media and any provider of the data contained in this website will not accept liability for any loss or damage as a result of your trading, or your reliance on the information contained within this website.
It is prohibited to use, store, reproduce, display, modify, transmit or distribute the data contained in this website without the explicit prior written permission of Fusion Media and/or the data provider. All intellectual property rights are reserved by the providers and/or the exchange providing the data contained in this website.
Fusion Media may be compensated by the advertisers that appear on the website, based on your interaction with the advertisements or advertisers.
© 2007-2024 - Fusion Media Limited. All Rights Reserved.