Gold strongly bullish
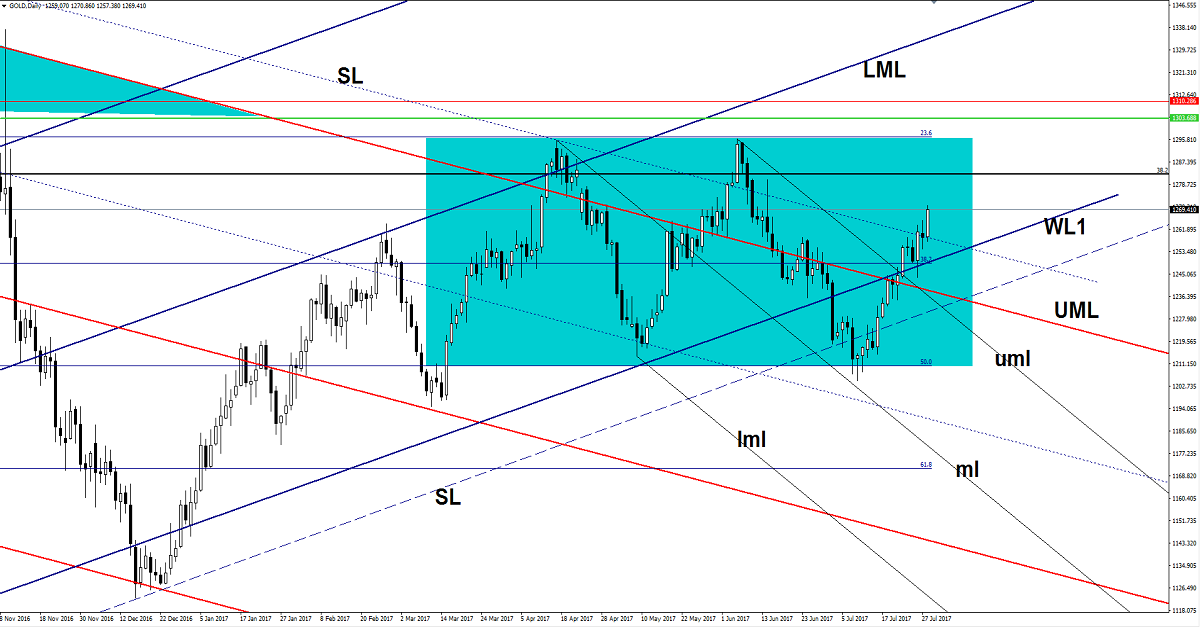
The price edges higher on the daily chart and should reach fresh new highs in the upcoming period, is strongly bullish as the DXY has plunged again. The yellow metal move sideways, but with a bullish perspective, is located in the buyer’s territory after a valid breakout above some major resistance levels.
Gold has taken advantage of the weak dollar, the DXY should drop much deeper on the Daily chart because looks too heavy to be stopped. DXY is still expected to reach the 92.49 static support, where he could find support again, right now we don’t have any reversal sign because the United States data continues to come in mixed.
The gold could climb much higher in the fresh start of the week if the Australian data will come in better, the HIA New Home sales and the MI Inflation will be released first, while the Private Sector Credit could increase by 0.4% and could match the 0.4% growth in the former reading period.
The Chinese Manufacturing PMI may increase from 51.7 to 51.5 signalling a further expansion, the Non-Manufacturing PMI will be released as well, a positive data will boost the Aussie, which will increase versus the greenback.
Price rallied on Friday and touched the 1270 level, should climb much higher in the upcoming days, the next upside target will be at the 38.2% retracement level. Most likely will ignore the mentioned obstacle if the DXY will slide further and could reach the 23.6% retracement level, which also represents the sideways movement resistance.
You can notice that the rate continues to move in range, but most likely will escape from this pattern after the breakout above the sliding line (descending dotted line).
USD/JPY bears in control
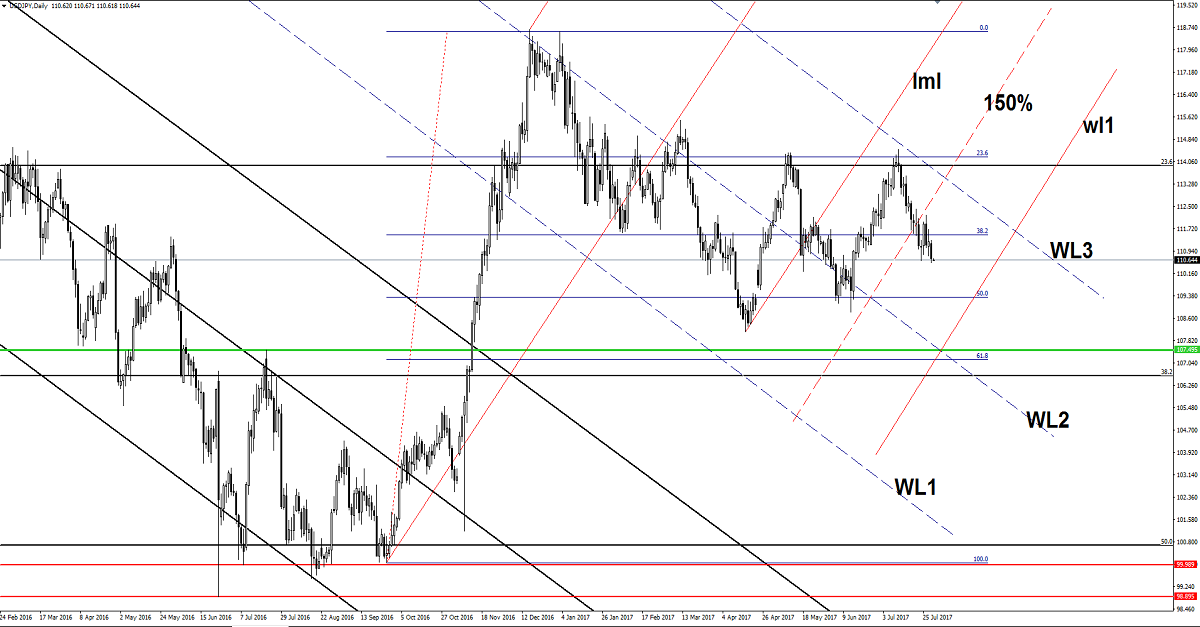
The USD/JPY is trading in the red and looks determined to resume the corrective phase, is trading right above the 110.50 level, but should touch the 109.50 very soon.
Personally, I believe that the yen will dominate the currency market in the upcoming weeks as the Nikkei could drop much deeper after several false breakouts above the 20058 major static resistance. JP225 is expected to approach and reach the 19700 level, a valid breakdown below this obstacle will open the door for more declines.
USD/JPY should reach the 50% retracement level and the warning line (wl1) of the former ascending pitchfork.
NZD/USD another breakout attempt
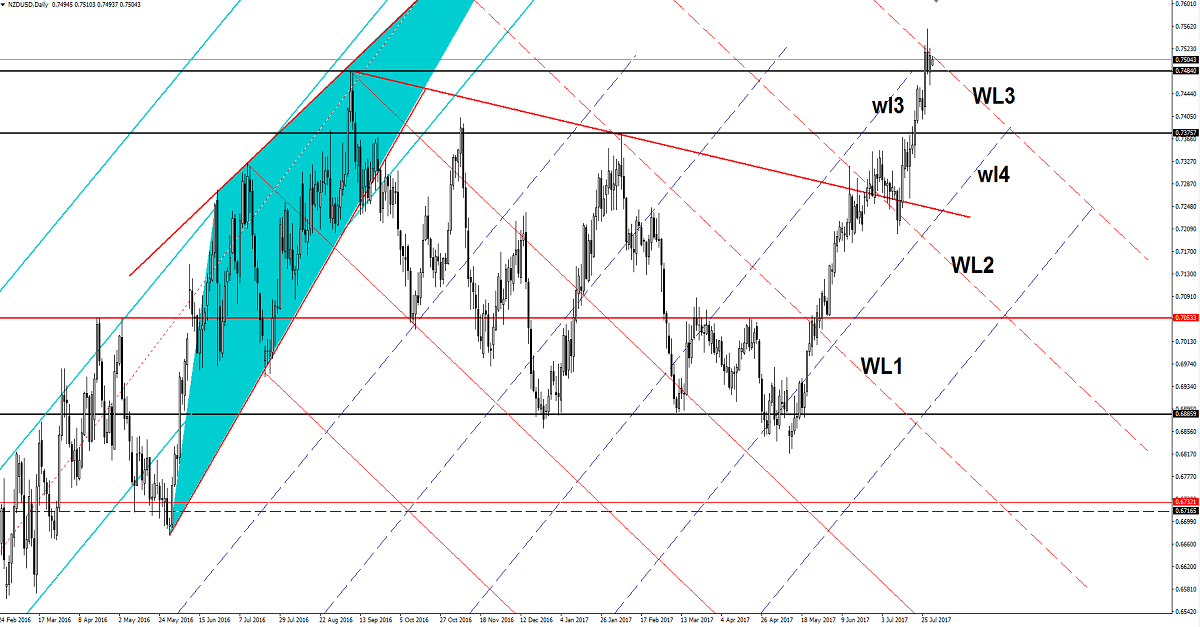
Price has managed to stay above the 0.7484 major broken static resistance and now is pressuring the warning line (WL3) again, a valid breakout will bring us a very good buying opportunity. However a rejection followed by a drop below the 0.7484 will confirm a drop towards the 0.7375 and towards the fourth warning line (wl4).


