EUR/USD
The euro trades in near-term consolidative phase, awaiting this week’s ECB meeting and following last week’s fresh acceleration lower, which resulted in the strongest weekly loss since July 2012 and posted fresh low at 1.1458. Overall negative tone favors further weakness, as the price approaches targets at 1.1375, low of Nov 2003 and 1.1210, Fibonacci 61.8% retracement of 0.8225/1.6039, 2000/2008 ascend. Descending hourly 20EMA, capped the upside action from new low at 1.1587, guarding 1.16 barrier and 38.2% retracement of 1.1845/1.1458 downleg and pivotal 1.1650, hourly lower platform and 50% retracement, close above which to signal stronger bounce from 1.1458 low, towards next breakpoint of daily 10SMA at 1.1750. Oversold daily studies so far do not show stronger signals of recovery, along with narrow-range trade on Asian session, seeing upside attempts limited for now.
Res: 1.1587; 1.1606; 1.1650, 1.1700
Sup: 1.1550; 1.1500; 1.1458; 1.1400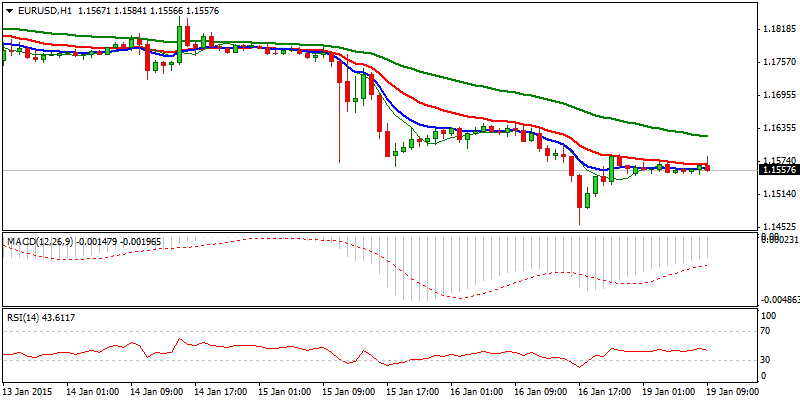
EUR/JPY
The pair remains under pressure and hit fresh low at 134.68 last Friday, as strong downside acceleration resulted in the third strong weekly close in red. Near-term price action trades in about 100-pips consolidation range, with negative setup of near-term studies and firmly bearish tone on larger timeframes, seeing increased downside risk, which is expected to accelerate after end of consolidative phase. Price approaches pivotal 134.12 support, low of 16 Oct 2014, break of which to trigger stronger correction of larger rally from 94.10, 1012 low to 149.76, 2014 high. Consolidation top lies at 136.20, near Fibonacci 38.2% of 138.77/134.68 downleg, with potential stronger bounce, required to clear 137 resistance, to open way towards breakpoint at 138.77, 15 Jan lower top and sideline immediate downside risk.
Res: 136.06; 136.25; 136.73; 137.21
Sup: 135.11; 134.68; 134.12; 133.50 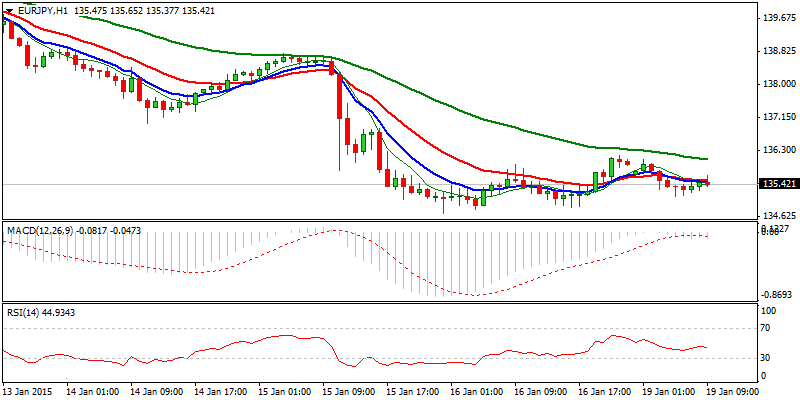
GBP/USD
The pair remains capped by fresh correction high at 1.5267, near Fibonacci 38.2% of 1.5618/1.5032 downleg, following unsuccessful attempts to close above descending daily 10SMA and keeping so intact far breakpoints at 1.5317, 05 Jan lower top and descending daily 20SMA at 1.5329, close above which is required to trigger stronger recovery. Negative daily / weekly close signals limited corrective actions ahead of fresh weakness towards initial target at psychological 1.50 level and key 1.4820 higher base.
Res: 1.5168; 1.5232; 1.5267; 1.5317
Sup: 1.5100; 1.5075; 1.5032; 1.5000 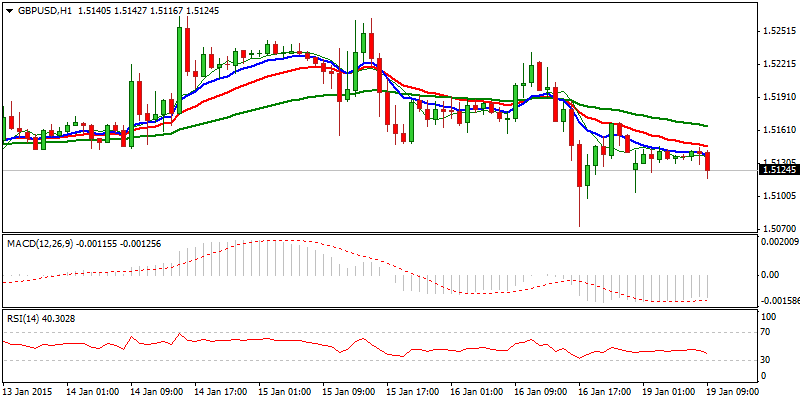
USD/JPY
The pair bounced last Friday, after posting fresh low at 115.83 and showed positive daily close, which averts immediate downside risk at pivotal 115.55 support, 16 Dec 2014 low and Fibonacci 38.2% retracement of Oct/Dec 2014 105.18/121.83 ascend. Negative weekly close, however, keeps the downside at risk, as recovery attempts stay capped under 118 barrier, by daily Tenkan-sen line and formation of daily 10/55SMA’s bear-cross. Break here and extension above 118.68, daily Ichimoku cloud top, is required to signal higher low and spark further recovery. Otherwise, expect fresh attempts lower, as daily indicators are establishing in negative territory and hourly bulls are losing traction. Close below 117 handle to confirm scenario.
Res: 117.75; 118.00; 118.68; 119.30
Sup: 117.00; 116.56; 115.83; 115.55 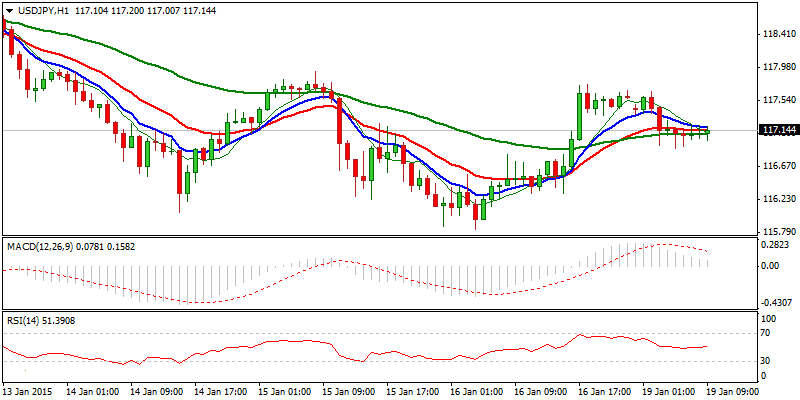
AUD/USD
The pair holds positive near-term tone, as last week’s recovery attempts peaked at 0.8293, but from the other side failed to close above previous high at 0.8253. Daily and weekly Doji, signals hesitation of recovery attempt from 0.8031 low, which requires break above 0.8373, 11Dec 2014 lower top, to signal stronger recovery. Mixed studies suggest more sideways trading in near-term, as hourlies are neutral, while 4-hour tone remains positive, with daily action underpinned by 10/20SMA’s bull cross, but descending daily 55SMA, maintaining pressure. Break of either pivotal point at 0.8131 or 0.8373, to establish fresh near-term direction.
Res: 0.8254; 0.8293; 0.8322; 0.8373
Sup: 0.8200; 0.8166; 0.8131; 0.8066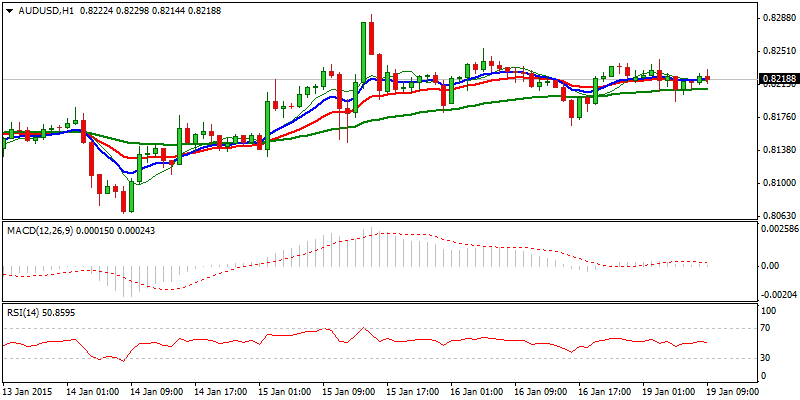
AUD/NZD
Near-term price action trades in consolidative mode under recovery peak at 1.0636, posted on 15 Jan, where rallies ran out of steam yesterday and subsequent quick pullback dipped below 105 handle. Daily 20SMA contained dips and underpins action which resulted in last Friday’s positive close. However, further upside attempts to be questioned, as near-term bulls are losing traction and alignment of daily MA’s are neutral/negative. Sustained break above 1.07 barrier is seen as minimum requirement for bullish resumption towards falling daily 55SMA at 1.0745, while downside extension below daily 20SMA at 1.0480, to signal formation of near-term H&S pattern, which would trigger fresh acceleration lower.
Res: 1.0580; 1.0636; 1.0700; 1.0743
Sup: 1.0520; 1.0480; 1.0457; 1.0418 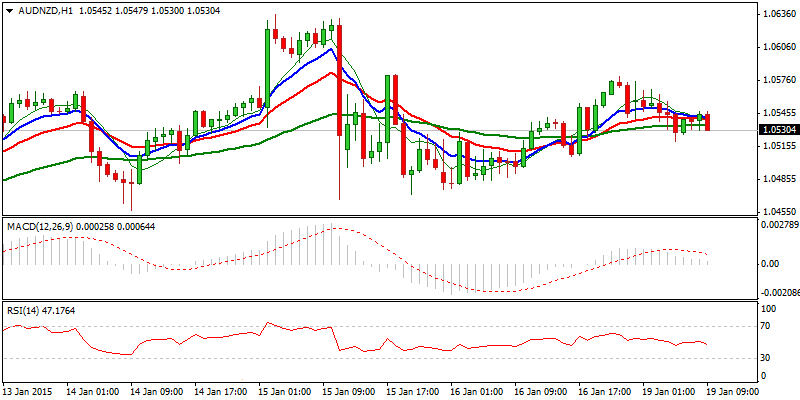
XAU/USD
Spot gold remains well supported and extended rally to fresh high at 1281, after taking out pivotal 1255 top, reinforced by 200SMA. Positive daily close and strongest weekly close since March 2014, maintain strong bullish stance, which looks for test of 1294, Fibonacci 76.4% of 1344/1131 descend and psychological 1300 barrier, in extension. Overbought near-term studies suggest corrective action, which should be ideally contained above 1255, former strong resistance, now marking pivotal support.
Res: 1281; 1296; 1300; 1319
Sup: 1268; 1260; 1255; 1247 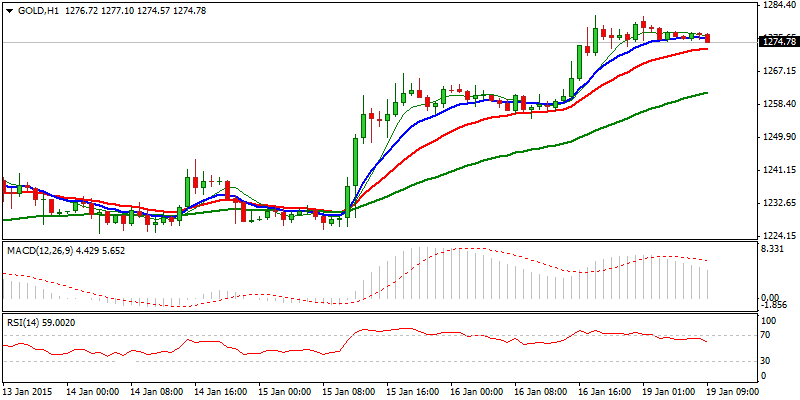
- English (UK)
- English (India)
- English (Canada)
- English (Australia)
- English (South Africa)
- English (Philippines)
- English (Nigeria)
- Deutsch
- Español (España)
- Español (México)
- Français
- Italiano
- Nederlands
- Português (Portugal)
- Polski
- Português (Brasil)
- Русский
- Türkçe
- العربية
- Ελληνικά
- Svenska
- Suomi
- עברית
- 日本語
- 한국어
- 简体中文
- 繁體中文
- Bahasa Indonesia
- Bahasa Melayu
- ไทย
- Tiếng Việt
- हिंदी
Daily Market Outlook: January 19, 2015
Published 01/19/2015, 04:54 AM
Updated 02/21/2017, 08:25 AM
Daily Market Outlook: January 19, 2015
Latest comments
Loading next article…
Install Our App
Risk Disclosure: Trading in financial instruments and/or cryptocurrencies involves high risks including the risk of losing some, or all, of your investment amount, and may not be suitable for all investors. Prices of cryptocurrencies are extremely volatile and may be affected by external factors such as financial, regulatory or political events. Trading on margin increases the financial risks.
Before deciding to trade in financial instrument or cryptocurrencies you should be fully informed of the risks and costs associated with trading the financial markets, carefully consider your investment objectives, level of experience, and risk appetite, and seek professional advice where needed.
Fusion Media would like to remind you that the data contained in this website is not necessarily real-time nor accurate. The data and prices on the website are not necessarily provided by any market or exchange, but may be provided by market makers, and so prices may not be accurate and may differ from the actual price at any given market, meaning prices are indicative and not appropriate for trading purposes. Fusion Media and any provider of the data contained in this website will not accept liability for any loss or damage as a result of your trading, or your reliance on the information contained within this website.
It is prohibited to use, store, reproduce, display, modify, transmit or distribute the data contained in this website without the explicit prior written permission of Fusion Media and/or the data provider. All intellectual property rights are reserved by the providers and/or the exchange providing the data contained in this website.
Fusion Media may be compensated by the advertisers that appear on the website, based on your interaction with the advertisements or advertisers.
© 2007-2024 - Fusion Media Limited. All Rights Reserved.
