
EUR/USD
The pair goes parabolic on Friday and closes the week resuming its upward movement flushing out of the market eventual sellers. The exchange rate snapped back to the weekly pivot point at 1.3756 on the opening and is presently managing to rebound almost as remarkably to pare the opening losses and closing exhaustion gaps. The overnight slide coincides with a 38.2% correction which could eventually lead to a deeper one towards the 50% confluent now with the 200-SMA on the hourly charts.
The oscillators mirror the price correction coming out of their overbought extremes but manage to flatten above their center lines. Any attempt to stage a new price high above 1.3825 could muster into a negative divergence in the MACD.
Res: 1.3826; 1.3852; 1.3900; 1.4150
Sup: 1.3773; 13756; 1.3722; 1.3642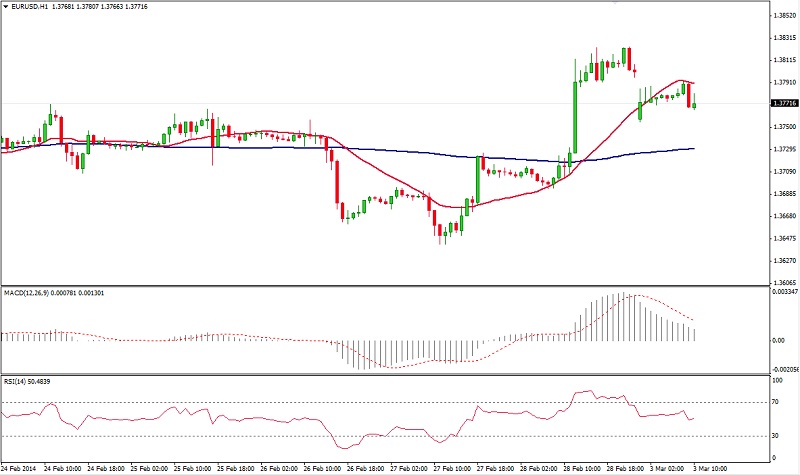 EUR/USD" title="EUR/USD" height="475" width="800">
EUR/JPY
Getting a lift from EUR/USD flows, the euro finished the week challenging the 141.00 figure. The opening around 139.70 happened with 61.8% correction from Friday's rally leaving the cross with a lack of definition as for trend direction. The MACD, albeit exhibiting an extreme high on Friday, is now printing in negative territory. The RSI in turn, could not sustain a break of the 70% mark in recent sessions and imploded back below the 50% line (currently at 41%). The pair trades now below the weekly pivot point at 140.11 with a series of small body candlesticks, indicative of indecision where to finish the session.
Res: 140.00; 140.11; 140.22; 141.34
Sup: 139.34; 139.10; 138.77; 136.20 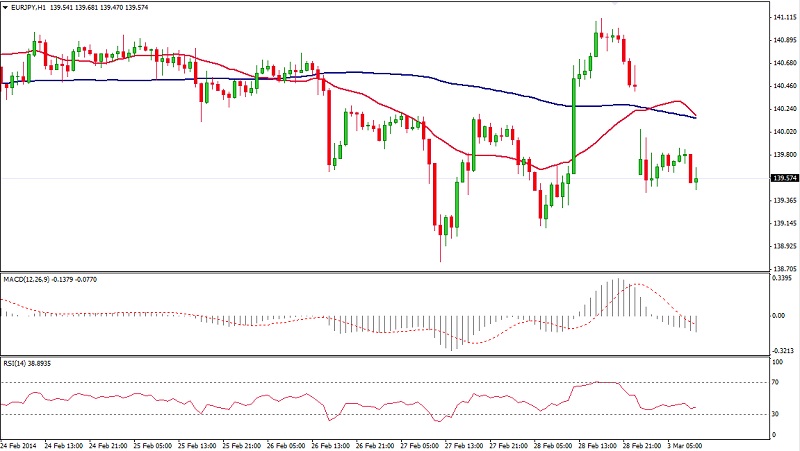 EUR/JPY" title="EUR/JPY" height="475" width="800">
GBP/USD
The Sterling managed to fill any possible opening gaps and looks positive against the dollar, currently trading above 1.6700. It is still trapped in the sideways range from the last two weeks, capped by 1.6820 on the upside and 1.6600 when looking south. The series of higher lows from recent sessions point to a potential recapture of the mentioned ceiling. The 200-SMA, while printing well below the current price, looks promising as well with its attempt to head higher. In turn, the upward sloping 100-SMA is where price is currently perched with some precarious intraday doji patterns. The oscillators are senn in positive numbers, specially the RSI which hasn't dipped below 50% in a while. A break of its narrow range could be taken as an early signal where the session is headed.
Res: 1.6780; 1.6800; 16820; 1.6874
Sup: 1.6728; 1.6700; 1.6636; 1.6600 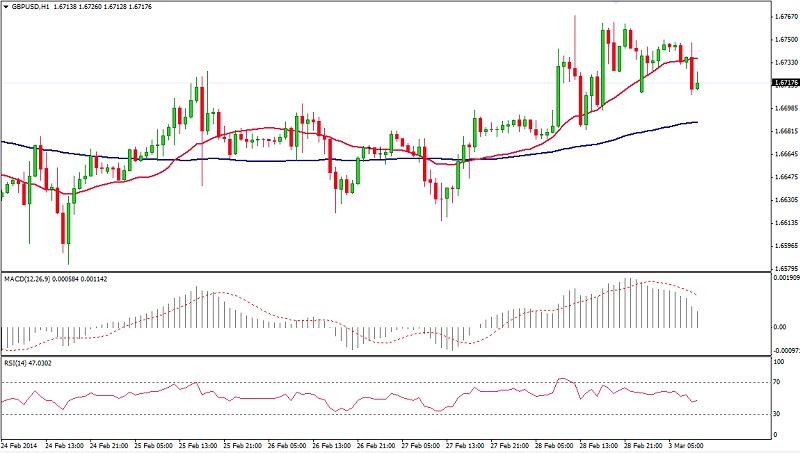 GBP/USD" title="GBP/USD" height="475" width="800">
USD/JPY
Traders are now more confident that serious inroads to the downside can be achieved in the USD/JPY. The dollar lost value against its Japanese counterpart on Friday and wasn't able to recover them on the open. Touching oversold levels on the hourly charts, the oscillators add credence to this bearish view. Lower lows on both MACD and RSI would set the stage for further weakness in this major pair en-route to sub 101.00 levels.
Res: 101.50; 101.87; 102.00; 102.20
Sup: 101.13; 100.71; 100.15; 99.77 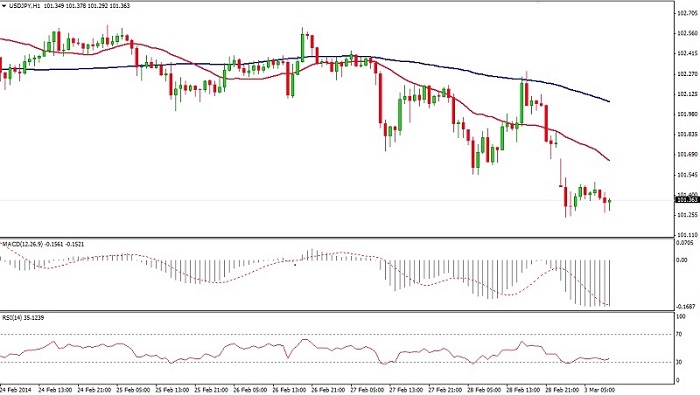 USD/JPY" title="USD/JPY" height="475" width="800">
AUD/USD
The Aussie is staging a V-shape reaction from a marginally lower low than the one printed on the 27th, in the vecinity of 0.89 building a double bottom structure neck-lined at 0.8989. The potential for the formation to act as a reversal pattern is slim due to the lack of a trend to be reversed. The bigger picture still looks sideways despite the recent volatility on lower time frames. The oscillators, still below their center lines, are shifting from an oversold picture to becoming witness of a notorious rally in the price action. The pair could extend gains up to the supply are found at 0.8970. On the way south , demand at the overnight lows could be exhausted and opening scope for a short-term turn lower towards support barriers at lower levels.
Res: 0.8944; 0.8970; 0.9000; 0.9017
Sup: 0.8900; 0.8870; 0.8825; 0.8750 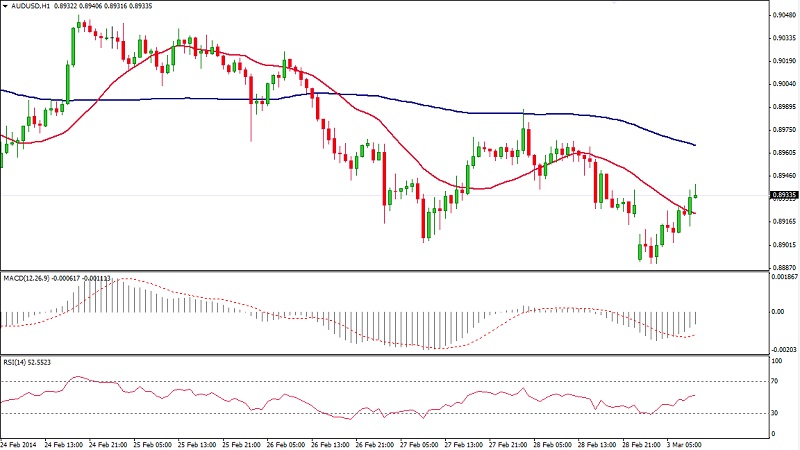 AUD/USD" title="AUD/USD" height="475" width="800">
AUD/NZD
The hourly structure continues to suggest a downside bias, in accordance with the major trend. Last week we say a corrective process which elevated the bulk of trading to the 1.0850 zone, but closing the week, the AUD/NZD plunged to multi-week lows around 1.0650 where it is presently quoting.
Should a a higher low be put in place above the 1.0480, the Pacific cross would become entitled for a deeper upside reaction. But there are still few technical arguments to compound such a bullish scope. The pair is struggling sustain itself above the daily pivot in recent trading with the MACD barely resurfacing the zero line. The RSI is performing similarly in the hope of morphing into a intraday bullish divergence. For this scenario to happen we would need a new intraday low below 1.0620 with higher lows in the oscillators.
Res: 1.0692; 1.0705; 1.0737; 1.0778
Sup: 1.0605; 1.0570; 1.0518; 1.0500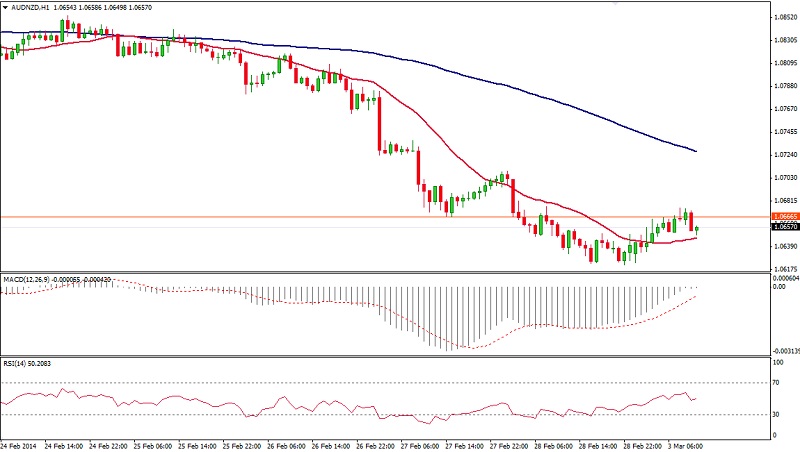 AUD/NZD" title="AUD/NZD" height="475" width="800">
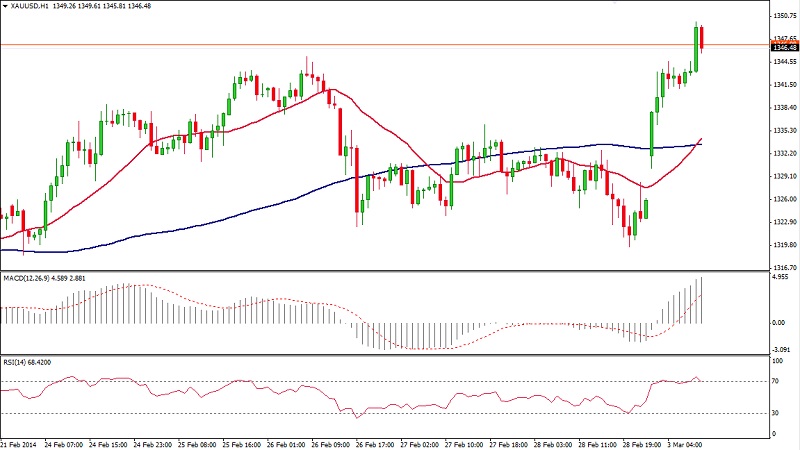
XAU/USD
Spot gold offers supplementary evidence of the unanimously bid on the U.S. dollar with its knocking on the door of the 1350 level. The yellow metal maintains a bullish bias follow two months of bullish offensive. On the short-time charts, the MACD, being an open indicator, is not yet at historical extremes but nevertheless rubbing shoulders with previous overbought levels. The RSI presents itself with an impressive run-up from the 30% level to the 70% where it decided to stay for the last hours.
A bullish SMA cross o the chart reaffirms the primary trend and reassures Gold could stay swinging in the breeze up around current levels.
Res: 1350.00; 1360.00; 1373.00; 1390.00
Sup: 1340.00; 1332.00; 1326.00; 1320.00
 XAU/USD" title="XAU/USD" height="475" width="800">
- English (UK)
- English (India)
- English (Canada)
- English (Australia)
- English (South Africa)
- English (Philippines)
- English (Nigeria)
- Deutsch
- Español (España)
- Español (México)
- Français
- Italiano
- Nederlands
- Português (Portugal)
- Polski
- Português (Brasil)
- Русский
- Türkçe
- العربية
- Ελληνικά
- Svenska
- Suomi
- עברית
- 日本語
- 한국어
- 简体中文
- 繁體中文
- Bahasa Indonesia
- Bahasa Melayu
- ไทย
- Tiếng Việt
- हिंदी
Daily Market Outlook: EUR/USD Managing A Rebound
Published 03/03/2014, 05:41 AM
Updated 02/21/2017, 08:25 AM
Daily Market Outlook: EUR/USD Managing A Rebound
3rd party Ad. Not an offer or recommendation by Investing.com. See disclosure here or
remove ads
.
Latest comments
Install Our App
Risk Disclosure: Trading in financial instruments and/or cryptocurrencies involves high risks including the risk of losing some, or all, of your investment amount, and may not be suitable for all investors. Prices of cryptocurrencies are extremely volatile and may be affected by external factors such as financial, regulatory or political events. Trading on margin increases the financial risks.
Before deciding to trade in financial instrument or cryptocurrencies you should be fully informed of the risks and costs associated with trading the financial markets, carefully consider your investment objectives, level of experience, and risk appetite, and seek professional advice where needed.
Fusion Media would like to remind you that the data contained in this website is not necessarily real-time nor accurate. The data and prices on the website are not necessarily provided by any market or exchange, but may be provided by market makers, and so prices may not be accurate and may differ from the actual price at any given market, meaning prices are indicative and not appropriate for trading purposes. Fusion Media and any provider of the data contained in this website will not accept liability for any loss or damage as a result of your trading, or your reliance on the information contained within this website.
It is prohibited to use, store, reproduce, display, modify, transmit or distribute the data contained in this website without the explicit prior written permission of Fusion Media and/or the data provider. All intellectual property rights are reserved by the providers and/or the exchange providing the data contained in this website.
Fusion Media may be compensated by the advertisers that appear on the website, based on your interaction with the advertisements or advertisers.
© 2007-2024 - Fusion Media Limited. All Rights Reserved.