
EUR/USD
The Euro comes under pressure in the near-term, as recovery attempt from near-term base at 1.3730 failed to sustain gains above 1.38 barrier. Subsequent easing weakens hourly structure and increases downside risk towards key supports at 1.3730/10, higher low / 4-hour 20/55DMA’s bullish crossover. Break here to further weaken the structure and signal prolonged consolidative phase that needs to hold above strong 1.3624 support, 20/12 higher low, reinforced by 4-hour 55DMA, to keep larger picture bulls intact for eventual push through 1.3892 peak towards psychological 1.4000 barrier.
Resistance: 1.3800; 1.3817; 1.3831; 1.3854
Support: 1.3730; 1.3700; 1.3655; 1.3624 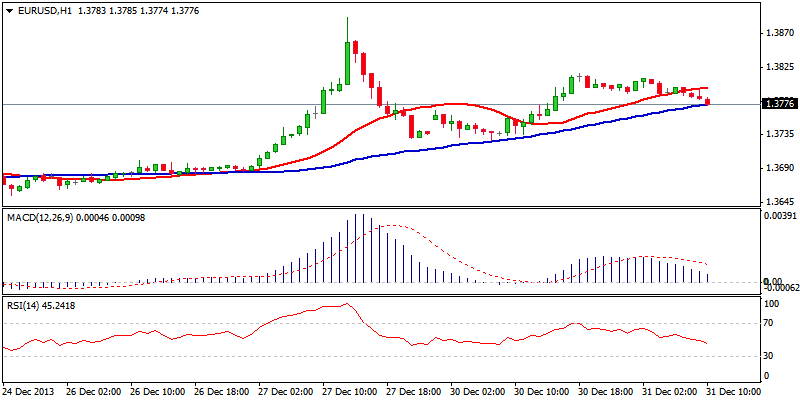 EUR/USD Hour Chart" title="EUR/USD Hour Chart" width="800" height="400">
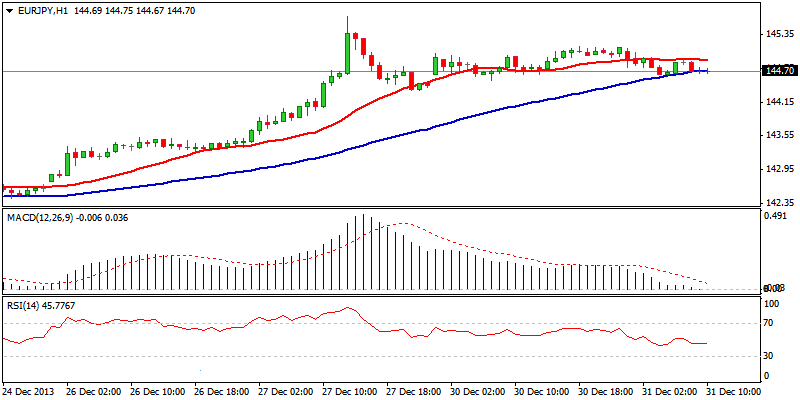
EUR/JPY
The pair consolidates recent rally that peaked at 145.67, with the price action being established within 144.36/145.15 range. However, weakening hourly studies and 4-hour indicators reversing from overbought zone, see risk of stronger pullback, with break below initial 144.36 support, Fibonacci 38.2% of 142.08/145.67 upleg, reinforced by 4-hour 20DMA, seen as a trigger. Further weakness to focus psychological 144.00 support, ahead of 143.45, Fibonacci 61.8% retracement and strong 142.81/88, 13/18 / 12 previous peaks and congestion tops, above which, stronger dips should be ideally contained. Otherwise, violation of the latter would neutralize near-term bulls, as overbought daily studies require caution.
Resistance: 144.89; 145.15; 145.67; 146.00
Support: 144.36; 144.00, 143.45; 143.00
 EUR/JPY Hour Chart" title="EUR/JPY Hour Chart" width="800" height="400">
GBP/USD
The Cable maintains positive near-term tone, as break above three-week congestion tops at 1.6466/86, cleared psychological 1.65 barrier and posted fresh high at 1.6577. Corrective pullback found footstep at 1.6450 zone, near 38.2% retracement of 1.6321/1.6577 rally / hourly 55DMA, with bounce above 1.6500 barrier, aiming towards recent peak at 1.6577. Positive near-term studies remain supportive for extension of larger uptrend through 1.6577 towards next targets at 1.6600, round figure; 1.6617, August 2011 high and 1.6737/45, May/April 2011 peaks, in extension. Higher platform formed at 1.6450, reinforced by 4-hour 20DMA, should keep the downside protected.
Resistance: 1.6577; 1.6600; 1.6617; 1.6650
Support: 1.6500; 1.6450; 1.6419; 1.6400 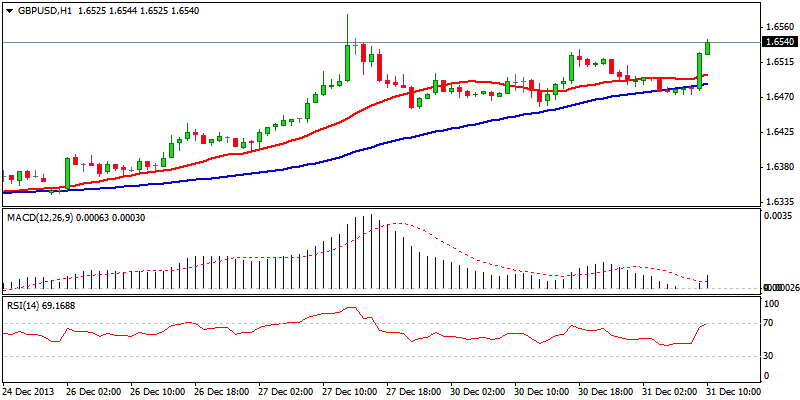 GBP/USD Hour Chart" title="GBP/USD Hour Chart" width="800" height="400">
USD/JPY
The pair trades in near-term corrective mode, off fresh high at 105.40, as slide below psychological 105.00 level found temporary support at 104.84, 26/12 former peak. Bounce through 105 barrier requires clearance of the session high at 105.14, to confirm formation of higher low and avert risk of stronger correction, as hourly indicators are gaining momentum, with positive 4-hour studies supporting the notion. Overall bulls remains firmly in play and favor further upside through initial 105.40 barrier, towards 105.58, Fibonacci 61.8% retracement of multi-year 124.14/75.55 descend and psychological 106.00 hurdle in extension. Initial support lies at 104.84, ahead of 104.64, 27/12 low / 20/12 high and 104.00, round figure / Fibonacci 38.2% retracement of 103.76/105.40 upleg.
Resistance: 1105.14; 05.40; 105.58; 106.00
Support: 104.84; 104.64; 104.39; 104.00 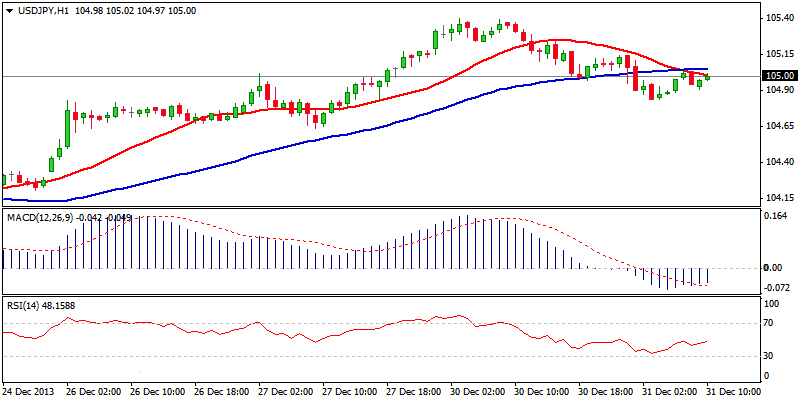 USD/JPY Hour Chart" title="USD/JPY Hour Chart" width="800" height="400">
AUD/USD
The pair regained strength and attempts at the upper boundary of near-term consolidative range at 0.8957, after one-week descend found footstep at 1.0832, where subsequent bounce commenced. Positive hourly technicals and 4-hour indicators breaking above their midlines, see scope for break higher, to confirm corrective phase under way, with break above psychological 0.9000 barrier, also 50% retracement of 0.9175/0.8819 downleg, required to confirm double-bottom formation and spark stronger recovery. Otherwise, failure to break above the range top, would signal further sideways trading and keep the downside vulnerable.
Resistance: 0.8947; 0.8957; 0.8968; 0.9000
Support: 0.8900; 0.8875; 0.8832; 0.8819 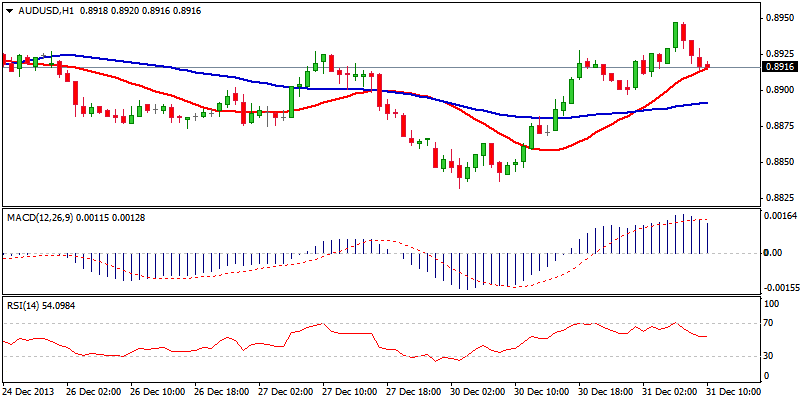 AUD/USD Hour Chart" title="AUD/USD Hour Chart" width="800" height="400">
AUD/NZD
Near-term structure weakens, as the price broke below consolidative range floor at 1.0870 and cracked 4-hour 55DMA on extension to 1.0833 so far. Studies on lower timeframes are negative and favor further weakness towards psychological 1.0800 support, 20/12 higher low / Fibonacci 61.8% of 1.0733/1.0911 recovery rally, loss of which to open key near-term support at 1.0733, 18/12 five-year low. The upside remains capped by daily 20DMA at psychological 1.0900 barrier, where false break occurred last week, with sustained break here and 1.0925, Fibonacci 61.8% of 1.1044/1.0733 fall, required to avert immediate downside risk.
Resistance: 1.0885; 1.0911; 1.0925; 1.0946
Support: 1.0833; 1.0800; 1.0775; 1.0733 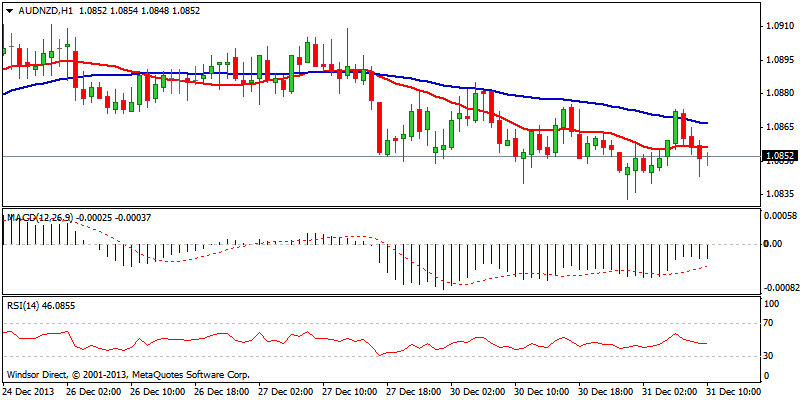 AUD/NZD Hour Chart" title="AUD/NZD Hour Chart" width="800" height="400">
XAU/USD
Spot Gold remains under pressure, losing psychological 1200 support and extending losses to 1294, Fibonacci 76.4% of 1186/1218 recovery rally so far. The price consolidates around 1200 handle, with near-term studies maintaining negative tone and seeing scope for eventual push towards initial support at 1186, 19/12 low and key support at 1180, 28/06 annual low. Further corrective action, which is expected to precede fresh leg lower, could be triggered on an break above 1200 barrier, hourly 20DMA and near 38.2% of 1218/1194 fall, for test of next hurdles at 1206/08, 50% retracement / hourly 55DMA, yesterday’s lower top, with stronger rallies to be capped by descending trendline off 1267 peak at 1215. Any break above here would sideline near-term bears and open way for stronger correction.
Resistance: 1203; 1208; 1215; 1218
Support: 1194; 1192; 1186; 1180 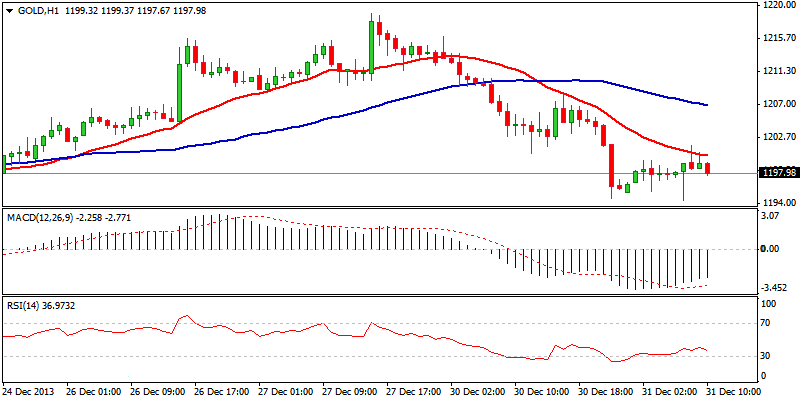 XAU/USD Hour Chart" title="XAU/USD Hour Chart" width="800" height="400">