
EUR/USD
The Euro nearly fully reversed two-day rally from 1.3830 to 1.3965, on fall to 1.3840, where the pair is attempting to base at Fibonacci 38.2% retracement of larger 1.3642/1.3965 ascend. Overall picture remains positive, with pause ahead of psychological 1.4000 barrier, seen as correction before fresh attempt higher. The notion is supported by positively aligned 4-hour technicals. Hourly tone is negative and cannot rule out further easing. However, strong supports at 1.3830, higher base, reinforced by 4-hour 55SMA and daily Tenkan-sen line, as well at 1.3800, psychological support, 28 Feb previous peak and 50% retracement, are seen as ideal reversing points for fresh attack at 1.40 barrier. Any violation here would delay bulls further and open downside supports at 1.3764, Fibonacci 61.8% retracement and 1.3700, psychological support and higher base, for test. On the upside, firm break and weekly close above 1.4000 hurdle, to confirm bulls fully in play and extend the third wave from 1.2744, towards its 100% expansion at 1.4386.
Res: 1.3876; 1.3900; 1.3965; 1.4000
Sup: 1.3830; 1.3800; 1.3764; 1.3700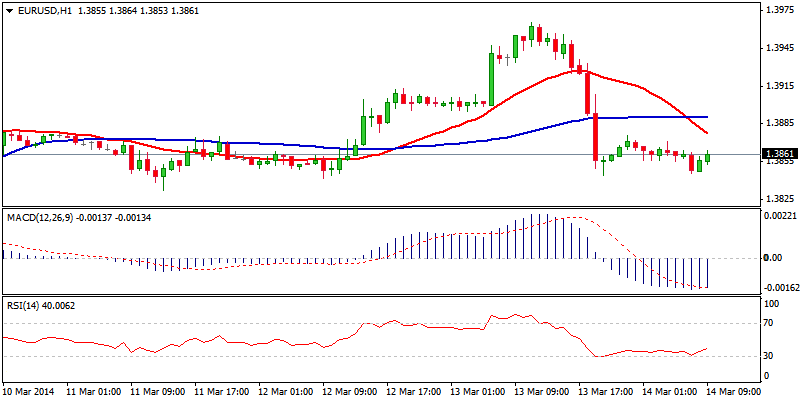 EUR/USD" title="EUR/USD" height="400" width="800">
EUR/JPY
The pair is attempting to stabilize at 140.60 zone, following yesterday’s sharp fall from 143.36, where the pair left lower top on a pullback from 143.78, 07 Mar upside rejection. Prevailing negative tone on the lower timeframes, sees risk of further easing, as the third wave that commenced from 143.36, reached its 161.8% Fibonacci expansion, also Fibonacci 61.8% retracement of 138.77/143.78 upleg. Pause in near-term bears is seen on a consolidation between fresh low at 140.60 and near-term congestion top at 141.31, as oversold conditions on hourly chart suggest consolidation, before fresh leg lower, towards psychological 140 support and breakpoint at 139.00/138.80, Fibonacci 61.8% retracement of 136.21/143.78 ascend and lower platform. However, break above 141.31 initial barrier, would delay immediate bears, while only regain of 142.00, round figure resistance and 5% retracement of 143.36/140.60 descend and 142.30, Fibonacci 61.8% retracement is required to neutralize bears.
Res: 141.31; 141.66; 142.00; 142.30
Sup: 140.60; 140.00; 139.10; 138.80 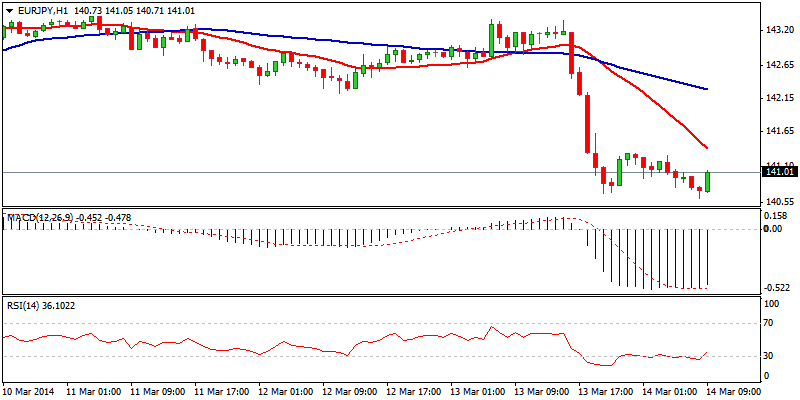 EUR/JPY" title="EUR/JPY" height="400" width="800">
GBP/USD
Cable trades in one-month sideways mode, trading within 1.3580 and 1.68 range, with near-term price action attempting at range’s lower boundary. Quick reversal off yesterday’s recovery peak at 1.6716 and attempt through 1.6600, psychological / Fibonacci 38.2% of 1.6250/1.6821 support, keeps near-term tone in negative mode, with downside risk being in play. Penetration through the range floor, reinforced by daily Kijun-sen line, would be a signal for stronger correction of larger 1.6250/1.6821 ascend and open its mid-point at 1.6536 and psychological 1.6500 support in extension. Only regain and break above lower top at 1.6716, will neutralize downside risk and confirm range-trading.
Res: 1.6625; 1.6670; 1.6716; 1.6740
Sup: 1.6566; 1.6536; 1.6500; 1.6468 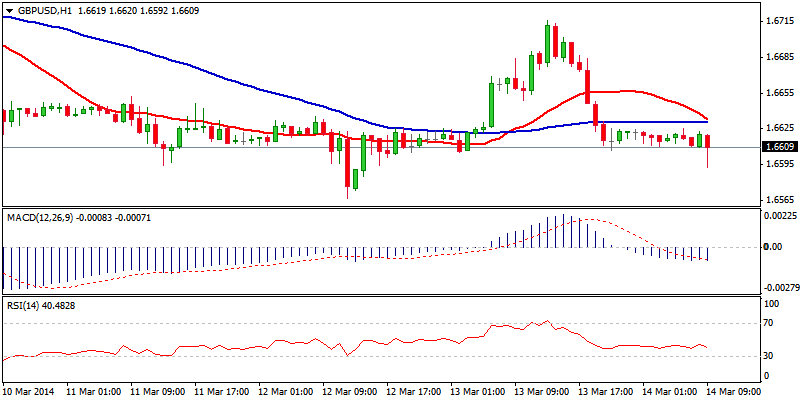 GBP/USD" title="GBP/USD" height="400" width="800">
USD/JPY
The pair remains under pressure, as one-week reversal off 103.75, 07 Mar peak, retraced the biggest part of 101.19/103.75 ascend, on a fall to 101.49 so far, where bull-trendline off 100.74 low, contained for now. Negative tone dominates on all timeframes and keeps the downside at risk. Near-term focus is turned towards key supports and breakpoints at 101.19 and 100.74, loss of which to signal an extension of larger downtrend from 105.43, 29 Dec 2013 peak and confirm formation of the third wave from 103.75, towards psychological 100 support and 98.88, its 100% Fibonacci expansion. However, oversold near-term conditions, leave room for consolidative/corrective action, with 102 barrier offering initial resistance, ahead of Fibonacci resistances at 102.35/89, 38.2% and 61.8% retracement levels, where rallies should be ideally capped. Any break above 103 handle would bring bulls back in play.
Res: 102.00; 102.35; 102.89; 103.00
Sup: 101.49; 101.19; 101.00; 100.74 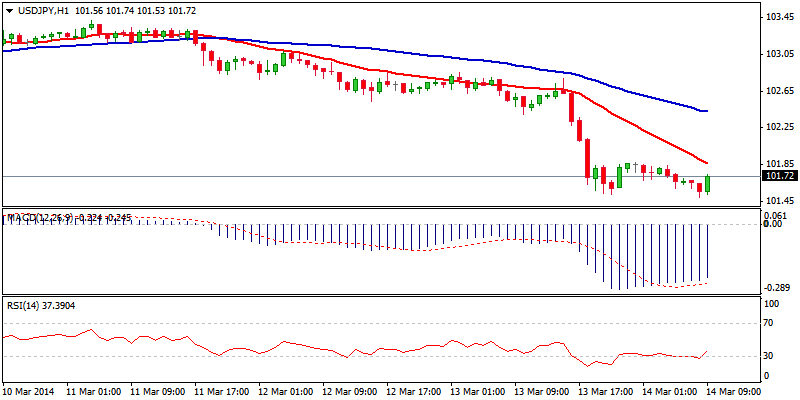 USD/JPY" title="USD/JPY" height="400" width="800">
AUD/USD
The pair trades in triangular consolidation under 0.9106, yesterday’s recovery rejection, with downside being so far protected at psychological 0.9000 support. Structure on 4-hour chart is neutral and sees scope for further consolidation, while negative tone on hourly chart maintains downside risk. Holding above 0.9000 handle keeps fresh attempts higher in play, as regain of 0.91 handle is seen as minimum requirement to revive bulls and open key barrier at 0.9132 for retest. Larger picture tone is positive, but lacks momentum for clear break above one-month congestion, capped at 0.9132. Increased downside risk towards higher low at 0.8923, will be seen on a penetration through 0.9000 support, with range floor at 0.8889, expected to come under pressure.
Res: 0.9039; 0.9079; 0.9100; 0.9132
Sup: 0.9000; 0.8970; 0.8923; 0.8889 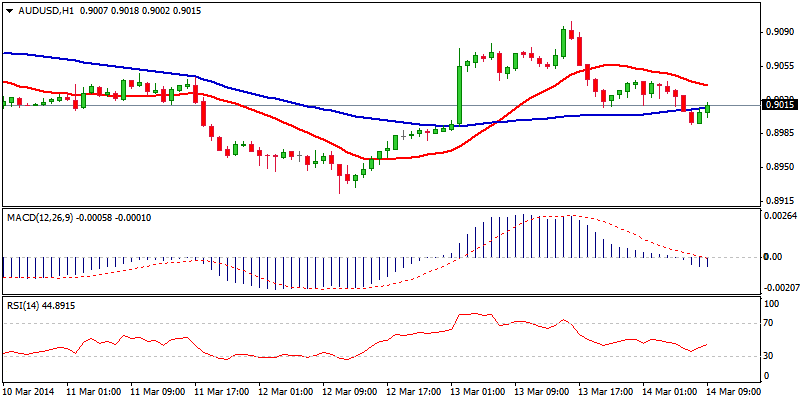 AUD/USD" title="AUD/USD" height="400" width="800">
AUD/NZD
Five-week downtrend off 1.0942, 04 Feb peak, remains in play and threatens full retracement of 1.0488/1.0942 upleg, as the price reached 1.0534 low so far. Prevailing negative tone on all timeframes supports the notion, with consolidative phases expected to interrupt bears. Previous low at 1.0624 and 12 Mar recovery peak at 1.0461, offer good barriers and only break of the latter, would delay immediate bears, in favor of stronger corrective action. Otherwise, fresh attempt through temporary support at 1.0534 and psychological 1.0500 handle, would signal extension of larger bear-trend.
Res: 1.0580; 1.0624; 1.0641; 1.0687
Sup: 1.0534; 1.0500; 1.0488; 1.0400 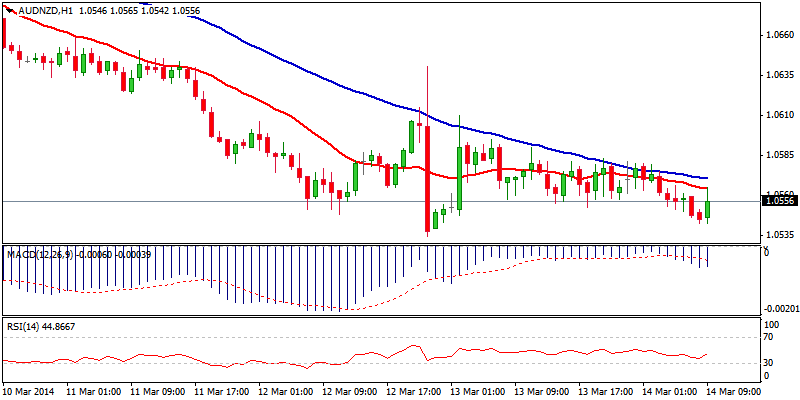 AUD/NZD" title="AUD/NZD" height="400" width="800">
XAU/USD
Spot Gold maintains firm bullish tone, as fresh extension higher retraced 76.4% of larger 1433/1182 descend on a rally to 1376 so far. Near-term focus is turned towards psychological 1400 barrier and key short-term hurdle at 1433, 28 Aug 2013 peak. Near-term price action, however, remains in consolidative sideways mode, with downside being protected at 1365, range floor and Fibonacci 23.6% of 1327/76 upleg. Overextended conditions on 4-hour chart, keep risk of further easing in play, with solid supports at 1358, Fibonacci 38.2% retracement and 1354, previous peaks of 03/06 Mar, expected to ideally contain extended pullbacks.
Res: 1376; 1400; 1416; 1433
Sup: 1365; 1358; 1354; 1346 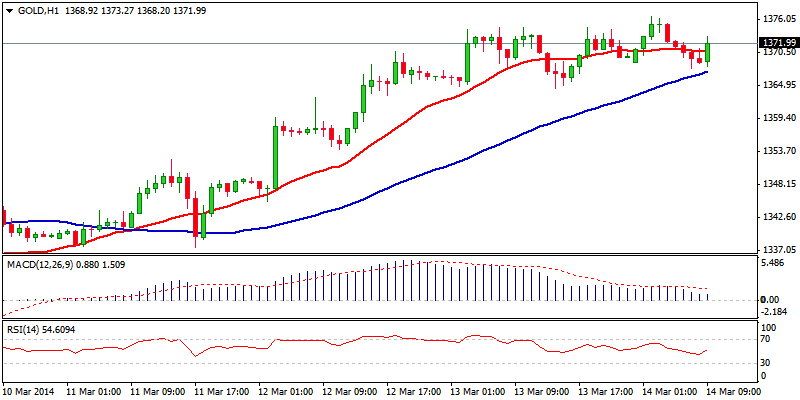 XAU/USD" title="XAU/USD" height="400" width="800">
- English (UK)
- English (India)
- English (Canada)
- English (Australia)
- English (South Africa)
- English (Philippines)
- English (Nigeria)
- Deutsch
- Español (España)
- Español (México)
- Français
- Italiano
- Nederlands
- Português (Portugal)
- Polski
- Português (Brasil)
- Русский
- Türkçe
- العربية
- Ελληνικά
- Svenska
- Suomi
- עברית
- 日本語
- 한국어
- 简体中文
- 繁體中文
- Bahasa Indonesia
- Bahasa Melayu
- ไทย
- Tiếng Việt
- हिंदी
Daily FX Outlook: 14.03.2014
Published 03/14/2014, 05:23 AM
Updated 02/21/2017, 08:25 AM
Daily FX Outlook: 14.03.2014
3rd party Ad. Not an offer or recommendation by Investing.com. See disclosure here or
remove ads
.
Latest comments
Install Our App
Risk Disclosure: Trading in financial instruments and/or cryptocurrencies involves high risks including the risk of losing some, or all, of your investment amount, and may not be suitable for all investors. Prices of cryptocurrencies are extremely volatile and may be affected by external factors such as financial, regulatory or political events. Trading on margin increases the financial risks.
Before deciding to trade in financial instrument or cryptocurrencies you should be fully informed of the risks and costs associated with trading the financial markets, carefully consider your investment objectives, level of experience, and risk appetite, and seek professional advice where needed.
Fusion Media would like to remind you that the data contained in this website is not necessarily real-time nor accurate. The data and prices on the website are not necessarily provided by any market or exchange, but may be provided by market makers, and so prices may not be accurate and may differ from the actual price at any given market, meaning prices are indicative and not appropriate for trading purposes. Fusion Media and any provider of the data contained in this website will not accept liability for any loss or damage as a result of your trading, or your reliance on the information contained within this website.
It is prohibited to use, store, reproduce, display, modify, transmit or distribute the data contained in this website without the explicit prior written permission of Fusion Media and/or the data provider. All intellectual property rights are reserved by the providers and/or the exchange providing the data contained in this website.
Fusion Media may be compensated by the advertisers that appear on the website, based on your interaction with the advertisements or advertisers.
© 2007-2024 - Fusion Media Limited. All Rights Reserved.