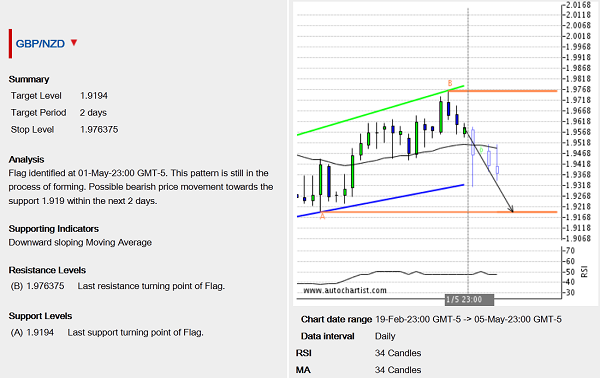
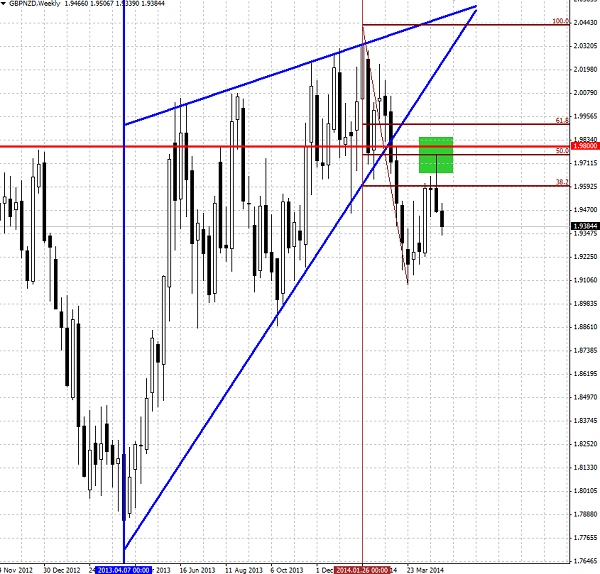
GBP/NZD continues to fall inside the daily Flag chart pattern that was previously identified by Autochartist – as you can see from the following trade opportunity alert for this currency pair. GBP/NZD is expected to break this Flag and then to fall to the target level 1.9194 (point A) in the next 2 trading days. Autochartist set the stop-level for this forecast at the top of this Flag – 1.9763 (point B). This point formed recently when the pair reversed down from the resistance zone lying between the resistance level 1.9800 (which corresponds to the breakout level of the weekly Rising Wedge from April of 2013) and 50% Fibonacci Correction of the downward impulse which broke the aforementioned Rising Wedge.

The weekly GBP/NZD chart below highlights the aforementioned resistance levels:

