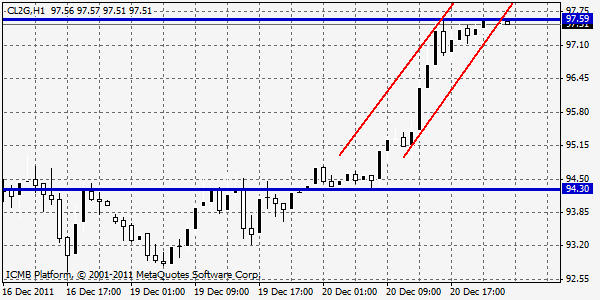
Oil rose for a second day as U.S. builders broke ground on more houses than at any time in the past 19 months and on speculation that further sanctions against Iran will curb supply. Prices gained 3.6 percent after the Commerce Department reported housing starts increased 9.3 percent last month to a 685,000 annual rate, exceeding the highest estimate of economists. Oil also rose as participants at a meeting in Rome vowed to increase pressure on Iran, the world’s No. 3 crude exporter, over its nuclear program. Prices are 6.4 percent higher this year after rising 15 percent in 2010. The more actively traded February contract rose $3.19 to $97.24. In the U.S., the economy is on the road to recovery, with falling unemployment and consistently improving growth against a background of low and falling oil stockpiles. U.S. crude inventories fell by 2.13 million barrels last week, according to the median estimate of 12 analysts surveyed. Meanwhile, another reason that could cut the production is the ongoing riot in Kazakhstan (KMG) western town of Zhanaozen. Riots spread this weekend in the Mangistau region. The area accounts for 25 percent of the country’s oil production of 1.6 million barrels a day.
GOLD
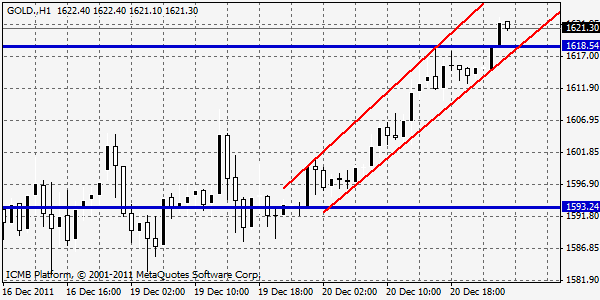
Spot gold last traded up $20.30 an ounce at $1,614.75. The precious metals saw bargain-hunting buying interest following recent strong selling pressure. Tuesday, it was also a risk on trading day in the market place. There was no major development in European debt crisis to damp the U.S dollar as a safe haven as a result it marked confusions to investors why gold was up. Given that gold has acted more like a risk asset in recent weeks that was also bullish the yellow metal. Barring any major flare-up in the European Union debt crisis or some other geopolitical surprise development, look for the precious metals and most other markets to quiet down and see low-volume trading until after the holidays. The major fund players have likely closed up their books for the year. There is also market talk this week that physical demand for gold will pick up significantly after prices have backed off recently. Technically, February gold futures prices closed nearer the session high. Still, near-term chart damage has been inflicted recently. Prices are still in a five-week-old downtrend on the daily bar chart. A bear flag or bearish pennant pattern could be forming on the daily bar chart. Bulls' next upside technical breakout objective is to produce a close above solid technical resistance at $1,650.00. Bears' next near-term downside price objective is closing prices below major technical support at the September low of $1,543.30. First resistance is seen at Tuesday’s high of $1,620.80 and then at $1,630.00. First support is seen at $1,600.00 and then at this week’s low of $1,585.50.
- English (UK)
- English (India)
- English (Canada)
- English (Australia)
- English (South Africa)
- English (Philippines)
- English (Nigeria)
- Deutsch
- Español (España)
- Español (México)
- Français
- Italiano
- Nederlands
- Português (Portugal)
- Polski
- Português (Brasil)
- Русский
- Türkçe
- العربية
- Ελληνικά
- Svenska
- Suomi
- עברית
- 日本語
- 한국어
- 简体中文
- 繁體中文
- Bahasa Indonesia
- Bahasa Melayu
- ไทย
- Tiếng Việt
- हिंदी
Daily Commodities Analysis: Oil and Gold
Published 12/21/2011, 08:48 AM
Updated 04/25/2018, 04:40 AM
Daily Commodities Analysis: Oil and Gold
CL2G
Latest comments
Loading next article…
Install Our App
Risk Disclosure: Trading in financial instruments and/or cryptocurrencies involves high risks including the risk of losing some, or all, of your investment amount, and may not be suitable for all investors. Prices of cryptocurrencies are extremely volatile and may be affected by external factors such as financial, regulatory or political events. Trading on margin increases the financial risks.
Before deciding to trade in financial instrument or cryptocurrencies you should be fully informed of the risks and costs associated with trading the financial markets, carefully consider your investment objectives, level of experience, and risk appetite, and seek professional advice where needed.
Fusion Media would like to remind you that the data contained in this website is not necessarily real-time nor accurate. The data and prices on the website are not necessarily provided by any market or exchange, but may be provided by market makers, and so prices may not be accurate and may differ from the actual price at any given market, meaning prices are indicative and not appropriate for trading purposes. Fusion Media and any provider of the data contained in this website will not accept liability for any loss or damage as a result of your trading, or your reliance on the information contained within this website.
It is prohibited to use, store, reproduce, display, modify, transmit or distribute the data contained in this website without the explicit prior written permission of Fusion Media and/or the data provider. All intellectual property rights are reserved by the providers and/or the exchange providing the data contained in this website.
Fusion Media may be compensated by the advertisers that appear on the website, based on your interaction with the advertisements or advertisers.
© 2007-2024 - Fusion Media Limited. All Rights Reserved.
