The risk unwind that began shortly after the FOMC decided to hold pat continued yesterday despite further falls in US interest rates. At the short end, implied interest rates on Fed funds futures were down across the board, with the yield on the August 2016 contract lower by 7.5 bps, while at the long end, 10yr bond yields fell around 5 bps – now off 20 bps from the pre-FOMC level. Yet the assault on the risk-sensitive currencies continued, with NZD as big a loser as its compatriots fighting for the America’s Cup. NOK and AUD also suffered notable declines. In EM, only CZK and PLN were modest gainers among the 15 currencies that we track; IDR was off a stunning 3.6% and MXN down over 1%, suggesting that while the Fed’s talk of tapering was bad for EM currencies, the delay is not necessarily going to be good for them. In this context, the only G10 currency to make modest gains against USD was the yen as investors took off risk.
Why has the reversal in Fed expectations not led to a reversal in market behaviour? Probably because some of the data shows that the Fed’s caution was warranted. Yesterday’s Ifo business climate survey was slightly weaker, while in the US, consumer confidence fell in September and the Richmond Fed survey was much weaker than expected. Rather than encouraging investors to continue with risk extension trades, the Fed’s caution may have made them worry about weakness in the US economy and by extension the global economy. They may start believing that New York Fed President William Dudley was correct when he said on Monday that the US has yet to show “any meaningful pickup” in momentum. The change in view on growth is reflected in the US stock market. Ahead of the FOMC meeting, the S&P 500 was up 11 days out of 12, but following the meeting it’s been down for four days in a row. My expectation is that this is just a “soft patch” for the data and that as more robust data comes out in the next several weeks, the risk-sensitive currencies should pick up again. But we shall have to see.
Today in Europe, French business confidence and Italian consumer confidence for September are coming out. Both are expected to rise slightly, which could support EUR/USD. There are two ECB speakers today; Mr. Asmussen speaks in Frankfurt and Mr. Weidmann speaks in Dusseldorf. Will they clarify or further muddy the discussion about what the ECB may or may not do? In the US, the headline durable goods orders figure for August is forecast to be down -0.2% mom, a notable improvement from July’s -7.3% mom fall. The headline number is still being distorted by large airplane orders, however. Excluding transportation equipment, orders are forecast to show a robust increase of 1.0% mom, a turnaround from -0.6% the previous month. That could prove to be USD-supportive. New home sales are forecast to have risen to a 420k annualized pace in August from 394k. That would also be a positive sign as it would show that higher mortgage rates had not dampened demand. Mercifully, there are no Fed speakers scheduled to confuse us further today.
The Market
EUR/USDEUR/USD" title="EUR/USD" src="https://d1-invdn-com.akamaized.net/content/pic5b67d4c7e6832aa711abcad079acab93.png" height="810" width="1729">
The EUR/USD continued moving lower, breaking below the 20-period moving average. Currently the pair is ready to test the blue uptrend line where a clear break below it should bring the bears face to face with the well tested level of 1.3400 (S1). If they are strong enough to overcome that hurdle, I expect them to extend their moves towards the 1.3321 (S2). Both the RSI and the MACD oscillator indicate neutral momentum, giving no clues for the forthcoming direction. Nonetheless, a bullish cross of the moving averages is remains in effect, and I still consider the recent downward movement as a short term correction.
• Support is found at the well tested level of 1.3400 (S1), followed by 1.3321 (S2) and 1.3232 (S3).
• Resistance levels are the level of 1.3512 (R1), followed by 1.3564 (R2) and 1.3706 (R3). The last one is found from the daily chart.
USD/JPYUSD/JPY" title="USD/JPY" src="https://d1-invdn-com.akamaized.net/content/pic41c5470342fa7eb734e48d83d976f4b8.png" height="810" width="1729">
The USD/JPY managed to break below the blue uptrend line and at the time of writing the pair is testing the 98.53 (S1) support. If selling pressure drives the price below that barrier, I believe that the move might continue towards the 97.87 (S2) level. Additionally, the 20-period moving average lies at the same level as the 200-period moving average, ready to cross below it and to confirm the bearish attitude of the rate. Both the RSI and the MACD oscillators continued their downward path, increasing the odds for further downward movement.
• Support levels are at 98.53 (S1), followed by 97.87 (S2) and 97.00 (S3).
• Resistance is identified at 99.15 (R1), followed by 99.66 (R2) and the psychological round number of 100.00(R3).
GBP/USDGBP/USD" title="GBP/USD" src="https://d1-invdn-com.akamaized.net/content/picaf4825a74d0d77e763839c6fa7ff6d22.png" height="810" width="1729">
The GBP/USD didn’t manage to stay above the psychological level of 1.6000, and during the European opening it is trading slightly below it. In previous comments, we mentioned that a break below that level might signal the end of a 5th Elliot wave and the beginning of a correcting phase. The correcting phase is also favored by the ADX reading being above 20, pointing upwards, with the –DI lying above the +DI. Signs of weakness are also provided by MACD’s value being less than its trigger’s and by the fact that the price crossed below the 20-period moving average.
• Support levels are identified at 1.5890(S1), 1.5840 (S2) and 1.5715 (S3) respectively.
• Resistance is found at the psychological level of 1.6000 (R1), followed by 1.6160 (R2) and 1.6276 (R3) (daily chart).
Gold
Gold moved sideways yesterday, remaining between the 1316 (S1) and 1335 (R1) levels. A break above the latter level should confirm my suspicions that the downtrend might have come to an end, since the yellow metal will complete the formation of a higher low. The alternative scenario would be that the price might find resistance at that level and continue its prior downtrend. Both the RSI and the MACD provide mixed indications and we should wait for the picture to get clearer in order to determine the direction.
• Support levels are at 1316 (S1), followed by 1291 (S2) and 1273 (S3).
• Resistance is identified at the 1335 (R1) level, followed by 1368 (R2) and 1394 (R3).
Oil
WTI continued its downward bias, but it was stopped by the support level at 102.23 (S1). During yesterday’s European evening the price returned back to the channel and at today’s opening is found testing the 103.53 (R1) resistance level. In my opinion, an upward penetration above that level should signal an upside pullback towards the next resistance areas. The probability of an upside pullback is also indicated by the RSI, which exited its oversold area, and by the MACD, which is ready to cross above its trigger line. Nonetheless, WTI is still in a downtrend, in my view, since the price is still trading into the downward slopping channel and the 20-period moving average lies below the 200-period moving average.
• Support levels are at 102.23(S1), 100.65 (S2) and 99.12 (S3). The last two are identified on the daily chart.
• Resistance levels are at 103.53 (R1), followed by 104.40 (R2) and 106.06 (R3).
BENCHMARK CURRENCY RATES - DAILY GAINERS AND LOSERS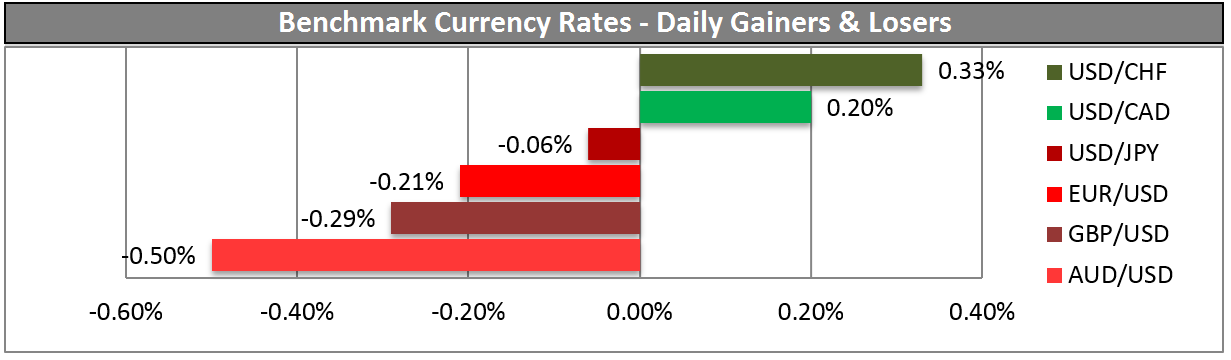
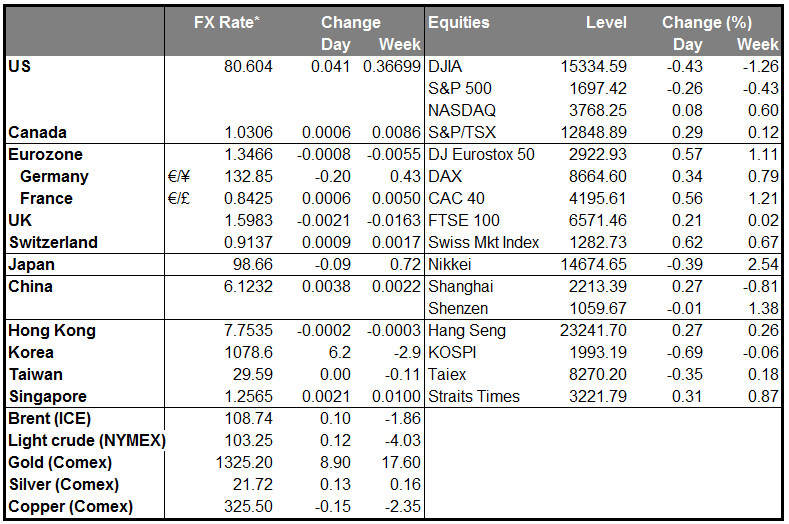
MARKETS SUMMARY