
Markets are flip-flopping based on risk-on, risk-off. The last 24 hours were risk-on and the dollar was lower against almost everything – all the G10 currencies and all 15 EM currencies that we track. As befits a risk-on environment, AUD was the biggest gainer and JPY gained the least. It was hard to see why, though; in fact, it seems to me that the tension in the Ukraine is increasing, particularly after the EU agreed on possible sanctions to take against Russia and the head of the US Joint Chief of Staffs, the top military official in the US, said that in the case of an escalation of unrest in Crimea, the U.S. Army is ready to back up Ukraine and its allies in Europe with military action. It seems to me that sentiment flipped to risk-on from risk-off after copper managed to bounce just under $3.00 a pound and staged a modest recovery, but I was unable to find out why that bounce happened, except perhaps for the technical reasons. EUR got some support from a comment by German Finance Minister Wolfgang Schäuble, who said that interest rates in the euro zone are too low from a German perspective. The statement reiterates Germany’s opposition to any new stimulus or rate cut from the ECB and reinforces the political difficulties that the ECB might have in cutting rates further. Nonetheless, yesterday’s movements overall remain a mystery to me and I would prefer not to invest based on mysteries. The reality is that the Ukraine situation is getting worse and the dynamics that have started in China have yet to play out, so I would expect more days like Tuesday – risk aversion that pushes USD up -- than like Wednesday in the near future.
Overnight the Reserve Bank of New Zealand (RBNZ) met and hiked the official cash rate (OCR) by 25 bps, as was universally expected. The RBNZ said it expects the OCR to rise by “about 2 percentage points” over the next two years, depending on economic conditions, although their forecast for the 90-day bill rate implies that rates continue to rise further well into 2016. The projected tightening is faster and longer than had been expected. I believe this course will distinguish NZD out of all the G10 currencies, especially as EUR and some other currencies (Sweden, Switzerland) struggle with deflation and push out the eventual start of their rate hiking cycle.
As the European day began, China announced that retail sales slowed dramatically to 11.8% yoy for January and February combined from +13.1% for all of last year (forecast: +13.5% yoy) and the nation’s industrial production for the same month also slowed more than expected to 8.6% for the two months from 9.7% in 2013 (expected: 9.5%). (January and February are reported together to offset the distortions caused by the Lunar New Year.) The news corroborates the message from the surprisingly weak trade figures China released earlier in the month and is likely to depress market sentiment.
During the European day, French CPI is forecast to have accelerated to +1.0% yoy in February from +0.8%yoy. Italy’s final CPI for the same month is also coming out. Sweden’s unemployment rate for February is estimated to have declined to 8.4% from 8.6% in January. Moreover, the ECB publishes its monthly report.
In the US, retail sales are forecast to have risen 0.1% mom in February, after remaining unchanged in January, while the excluding autos and gasoline figure is expected to have been up 0.2% mom, a turnaround from -0.2% mom the previous month. Initial jobless claims for the week ended on Mar 8 are forecast at 330k vs 323k the previous week. That would bring the four-week moving average slightly down to 334k from 336.5k.
From Canada, the new housing price index for January is expected to have risen 0.1% mom, the same as in December.
We have five speakers on Thursday’s agenda. ECB President Draghi speaks on the occasion of the awarding ceremony of the Schumpeter Award, while ECB’s Cœuré speaks on “Achieving a fully integrated banking union – the three pillars of the European Central Bank”. In the US, the Senate Banking Committee will hold a hearing to consider the nominations of Stanley Fischer, Lael Brainard and Jerome Powell for terms on the Federal Reserve's Board of Governors.
The Market
EUR/USD
 EUR/USD Hour Chart" title="EUR/USD Hour Chart" width="474" height="242">
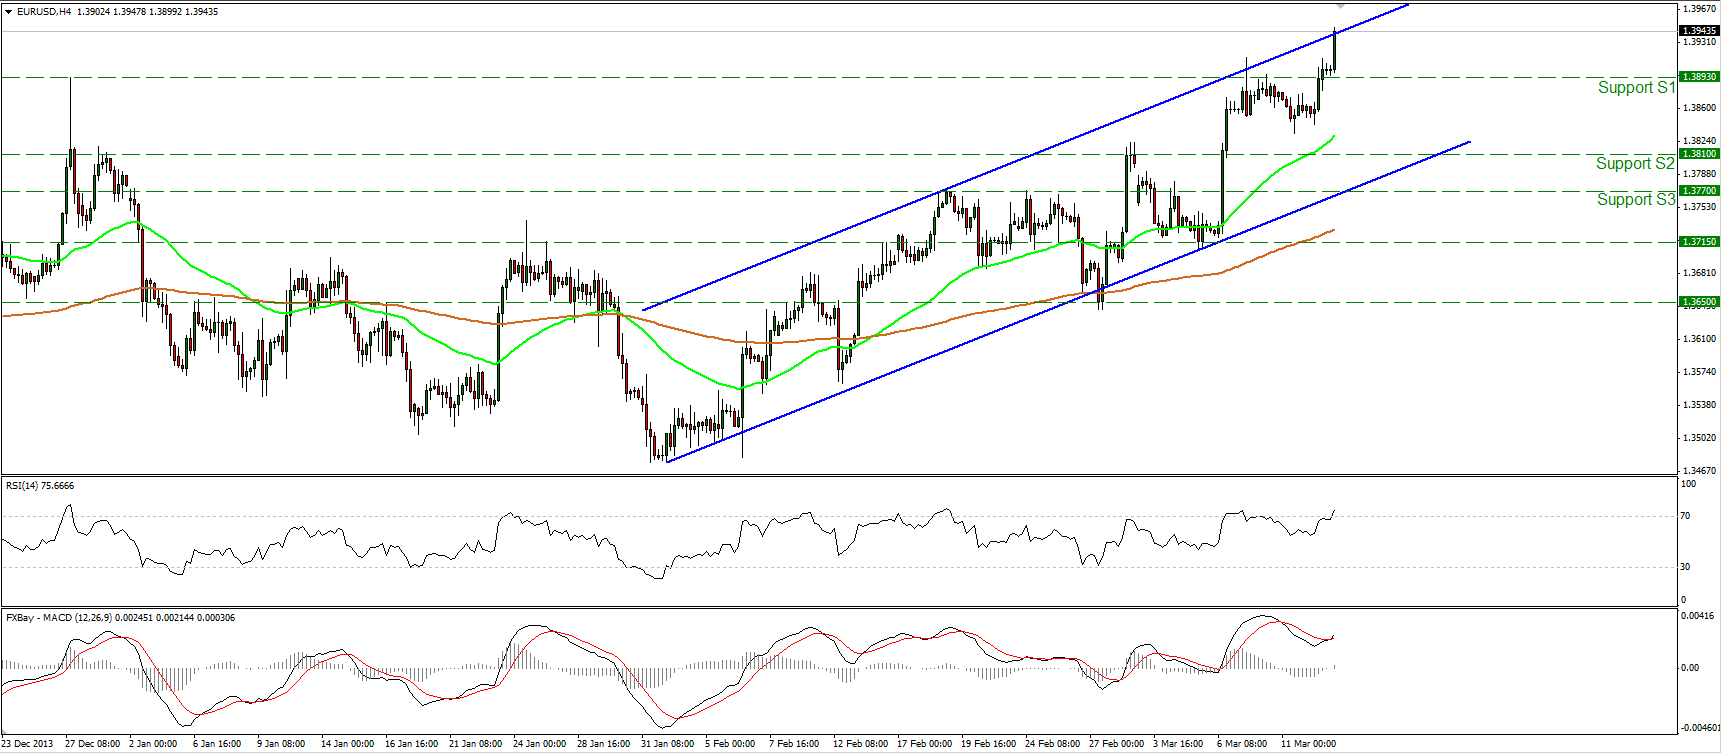
The EUR/USD rallied once again and managed to overcome the 1.3893 hurdle. Such a break confirms the resumption of the longer-term uptrend and I would expect the longs to target the 1.4000 (R1) key resistance first, where a break may pave the way towards 1.4200 (R2). The structure of higher highs and higher lows remains in progress and since the rate is trading above both the moving averages, the outlook remains to the upside. The MACD, already in its bullish territory, crossed above its trigger line, indicating strengthening bullish momentum. I would not rely on the overbought reading of the RSI since the oscillator is pointing up.
• Support: 1.3893 (S1), 1.3810 (S2), 1.3770 (S3).
• Resistance: 1.4000 (R1), 1.4200 (R2), 1.4550 (R3).
USD/JPY
 USD/JPY Hour Chart" title="USD/JPY Hour Chart" width="474" height="242">
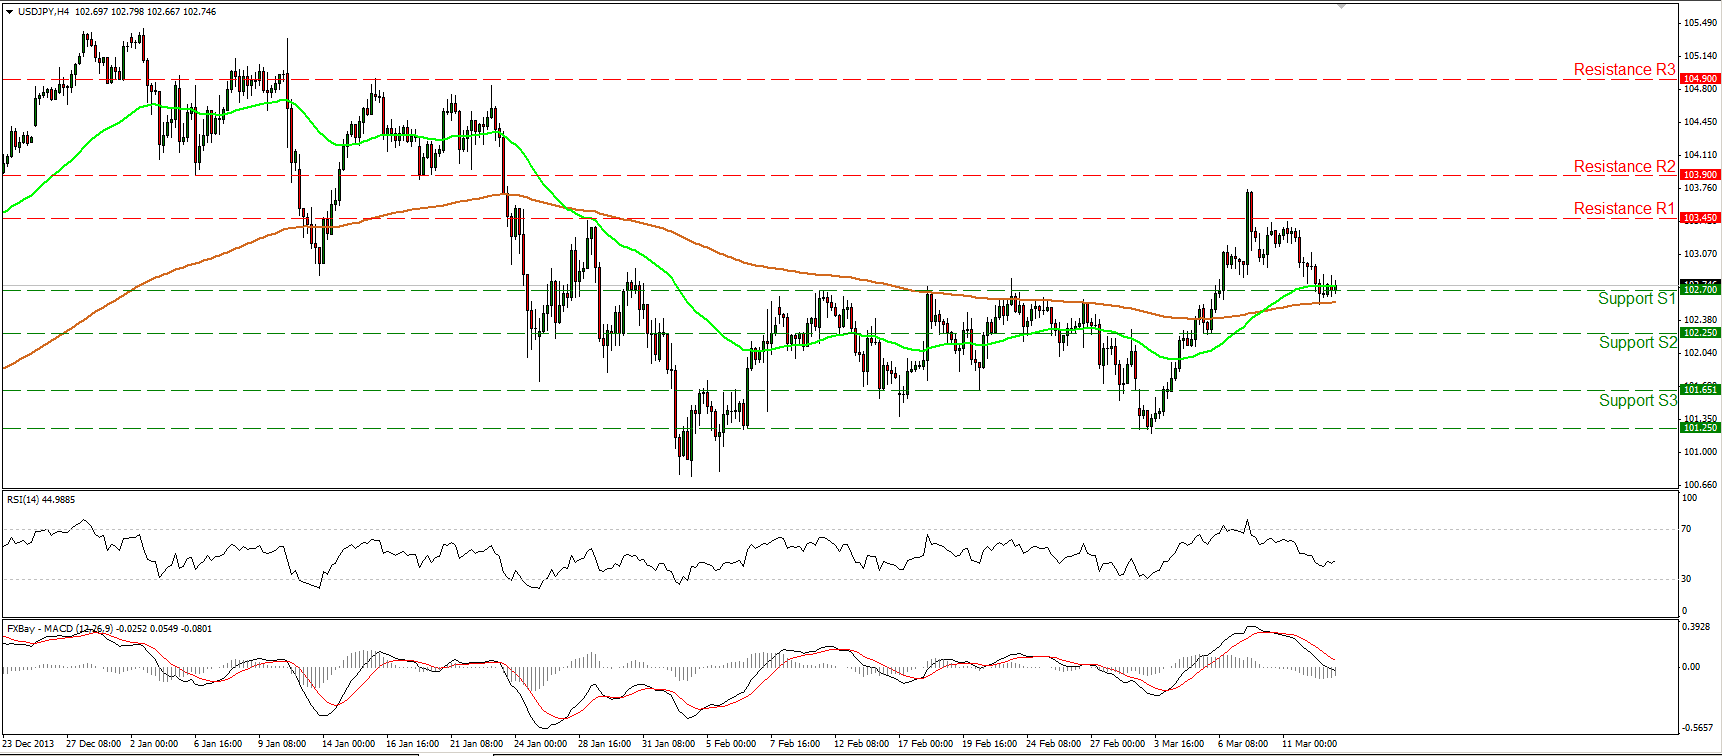
The USD/JPY moved lower and reached the 102.70 (S1) barrier, to test it as a support this time. A rebound near that level would confirm a higher low and target once again the resistance at 103.45 (R1). The rate remains supported by the 200-period moving average and a dip below it and the 102.70 (S1) will turn the outlook neutral first. Only a dip below the previous low at 101.25 would turn the overall short term picture negative, in my view.
• Support: 102.70 (S1), 102.25 (S2), 101.65 (S3)
• Resistance: 103.45 (R1), 103.90 (R2), 104.90 (R3).
EUR/GBP
 EUR/GBP Hour Chart" title="EUR/GBP Hour Chart" width="474" height="242">
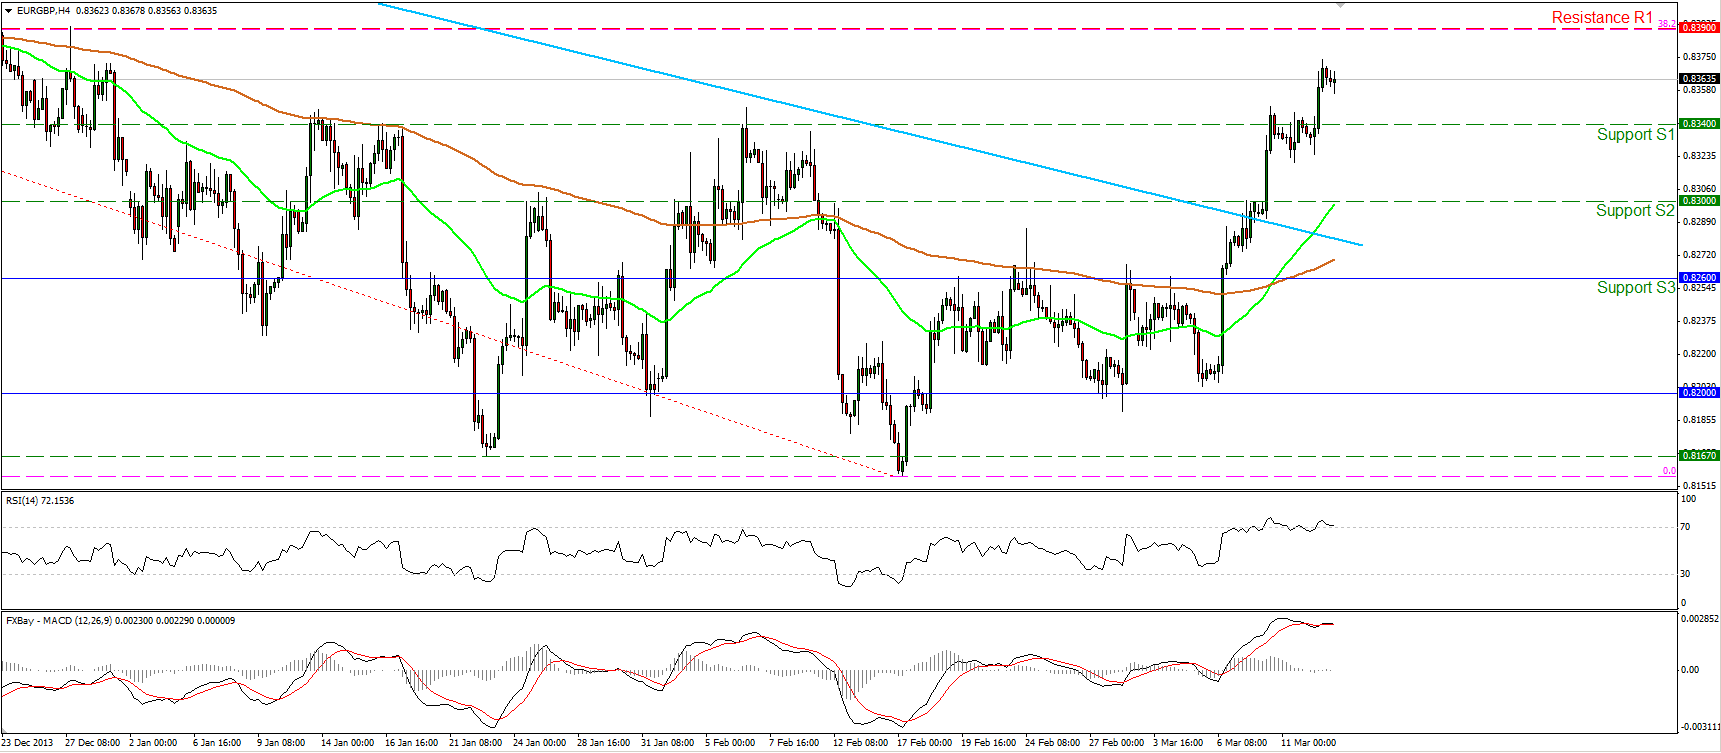
The EUR/GBP managed to violate the 0.8340 hurdle, after consolidating slightly below it. I still expect the price to reach the next hurdle at 0.8390 (R1) which coincides with the 38.2% retracement level of the 1st Aug. - 17th Feb. downtrend. The RSI remains within its overbought territory, testing the 70 barrier, thus some consolidation or a pullback before the development of further advance cannot be ruled out.
• Support: 0.8340 (S1), 0.8300 (S2), 0.8260 (S3).
• Resistance: 0.8390 (R1), 0.8460 (R2), 0.8535 (R3).
Gold

Gold broke above 1360 and reached 1375 (R1). A clear close above that resistance may pave the way towards the next hurdle at 1395 (R2). The MACD remains above both its trigger and signal lines, pointing up and confirming the recent bullish momentum. I would ignore the overbought reading of RSI at the moment and I would expect a pullback after the oscillator exits the extreme zone. On the daily chart, the precious metal remains supported by the 200-day moving average, increasing the possibilities for further advance.
• Support: 1360 (S1), 1354 (S2), 1332 (S3).
• Resistance: 1375 (R1), 1395 (R2), 1415 (R3)
Oil

• WTI continued declining, pushed lower by news that the US would sell some 5mn barrels from the Strategic Petroleum Reserve. Although officials said this was a test of the system that had been planned earlier and had nothing to do with Ukraine, market participants saw it either as a shot across the bows for Russia – warning them that the US would hit them where it hurt, in their wallet – or a way to calm the market’s fears of what a possible reduction in Russian supplies might do to prices. It was noticeable that despite the US denials, the type of crude that they decided to sell was similar to that which Russia sells.
• WTI reached the lower boundary of the downward sloping channel, near the 98.00 (S1) support, the 50% retracement of the 9th Jan. – 3rd Mar. uptrend and the 161.8% extension of the width of the failure swing mentioned in previous comments. A clear dip below that support area may target the 61.8% retracement of the 9th Jan. – 3rd Mar. uptrend which coincides with the 200% extension of the pattern’s width, near the support of 96.50 (S2). Nonetheless, since the RSI is ready to exit oversold conditions and the price is finding support at the lower bound of the channel, I would expect an upward corrective wave before the bears prevail again.
• Support: 98.00 (S1), 96.50 (S2), 95.00 (S3)
• Resistance: 100.75 (R1), 103.25 (R2), 105.00 (R3).
BENCHMARK CURRENCY RATES - DAILY GAINERS AND LOSERS

MARKETS SUMMARY

Disclaimer: This information is not considered as investment advice or investment recommendation but instead a marketing communication. This material has not been prepared in accordance with legal requirements designed to promote the independence of investment research, and that it is not subject to any prohibition on dealing ahead of the dissemination of investment research. IronFX may act as principal (i.e. the counterparty) when executing clients’ orders. This material is just the personal opinion of the author(s) and client’s investment objective and risks tolerance have not been considered. IronFX is not responsible for any loss arising from any information herein contained.
Past performance does not guarantee or predict any future performance. Redistribution of this material is strictly prohibited. Risk Warning: Forex and CFDs are leveraged products and involves a high level of risk. It is possible to lose all your capital. These products may not be suitable for everyone and you should ensure that you understand the risks involved. Seek independent advice if necessary. IronFx Financial Services Limited is authorised and regulated by CySEC (Licence no. 125/10). IronFX UK Limited is authorised and regulated by FCA (Registration no. 585561). IronFX (Australia) Pty Ltd is authorized and regulated by ASIC (AFSL no. 417482)