
The Big Picture
PMI Day The dollar was generally stronger this morning, gaining against most G10 and EM currencies. The only real exception in the G10 was the CAD. USD/CAD surged through 1.12 in early US trading Friday but then fell back sharply as money managers rebalanced their hedges at the end of the month. Given the technical nature of the move, I expect it will be only temporary and this pull-back may represent a good opportunity to establish new short-CAD positions. The government and the central bank agree that the currency is too strong; why fight them? On the other hand, the dollar’s gains against SEK, CHF, EUR and NOK were fairly even. It gained less against GBP and the two other commodity currencies. the AUD/USD was down only slightly after the official Chinese PMI came in as expected at 50.5. The Australian PMI on the other hand fell further into below-50 territory and Australian building approvals were below expectations. The NZD rebounded after the Treasury said the Reserve Bank of New Zealand is expected to raise rates in March, which everyone knew already but it’s nice to have it officially confirmed.
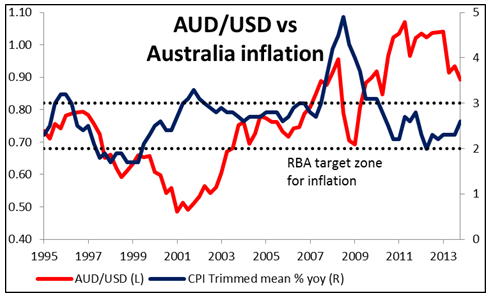
Today is January PMI day. We already had the official Chinese PMI – as expected – and the Australian PMI – a decline. Note from the graph what outliers Australia and China are – Australia with its accelerating contraction and China with its decelerating expansion (according to the official PMI – the HSBC/Markit PMI says it has an accelerating contraction.) This is yet another reason why I remain bearish on AUD/USD. France also stands out within the Eurozone. Sweden’s PMI rose unexpectedly to 56.4 from 52.2. During the European day we will get PMIs from Norway, Switzerland, Italy and the UK. The UK PMI is expected to be unchanged from December, which should at least keep GBP steady. Germany, France and Eurozone as a whole also publish their final manufacturing PMIs for the same month. In US, the ISM manufacturing PMI is forecast to have fallen to 56.0 from a revised 56.5 in December. That could dent the strong dollar temporarily.
 AUD/USD vs Australian Inflation" title="AUD/USD vs Australian Inflation" width="474" height="242">
We have only one speaker scheduled: ECB executive board member Sabine Lautenschlaeger testifies at the European Parliament’s economic and monetary affairs committee in a hearing on her nomination to be vice chair of the ECB’s new supervisory Board.
As for the rest of the week, the main event will be the ECB meeting on Thursday. The market focus on this decision is increased after Friday’s announcement that inflation in the Eurozone slowed to +0.7% yoy from +0.8% yoy. Remember that the ECB cut rates back in November after the CPI dropped to +0.7% yoy from +1.1% yoy, and since then it has consistently warned that its mandate is “symmetrical,” that is to say, it is as worried about inflation being too far below target as it is about inflation being above target. Last month ECB President Draghi dismissed a drop in German inflation as a technicality related to a change in how they calculate the index; the market will be waiting to see whether he considers this month’s decline also to be a technicality or whether it is symptomatic of something the ECB should be concerned about. We also have a Bank of England rate decision at the same day, although those are generally non-events owing to the Bank’s forward guidance. It will be much more important to see what changes the Bank makes to that forward guidance in the following week’s Inflation Report.
Finally, there will be an RBA meeting on Tuesday. The market is pricing in a 96% probability that they do not change rates, so that looks pretty certain; the big question then will be what hints they give for the direction of future policy. Since September, Gov. Stevens has ended his statement with a neutral comment that “The Board will continue to assess the outlook and adjust policy as needed…,” without giving any indication whether they think they will need to adjust rates upward or downward next. That will be the market’s focus. Some people have argued that with inflation at 2.7%, in the upper half of their 2% to 3% range, it’s unlikely that they make any hints about easing policy. The last time they hinted about easing rates, in July, they said that “The Board also judged that the inflation outlook, as currently assessed, may provide some scope for further easing…” They then cut rates the next month. However, inflation then was 2.5%, not far above where it is now, and note that they stressed the inflation outlook, not the current inflation situation. It’s possible that with China slowing and the Australian economy also weak, they come to the same conclusion again and hint about another cut in rates, which would weaken the AUD further – a result that they would probably welcome.
The other big event of the week will be the US non-farm payrolls for January. The figure is forecast to return to its normal levels, at +181k, after the surprisingly small rise of +74k in December. The US unemployment rate is estimated to have remained unchanged at 6.7%. Rising NFP and a steady unemployment may erase concerns whether the unemployment fell for bad reasons in December and as a result support the USD.
As for the indicators, on Tuesday, in Europe, we have the UK construction PMI for January and Eurozone’s PPI for December. The latter is expected to show a further decline in producer prices, which could add to the downward pressure on EUR ahead of the ECB meeting. From the US we have December factory orders and from New Zealand we get the unemployment rate for Q4. On Wednesday, we get the service-sector PMIs for January from several countries of Europe and the Eurozone as a whole. Eurozone’s retail sales for December are also coming out. In US, the ADP employment change and the ISM non-manufacturing PMI, both for January, are coming out. On Thursday we get December trade data for from Australia and the US. German factory orders for the same month are also coming out. On Friday the UK industrial and manufacturing production for December and German industrial production for the same month will be released. Canada’s unemployment rate for January is also coming out
The Market
 EUR/USD Hourly Chart" title="EUR/USD Hourly Chart" width="452" height="189">
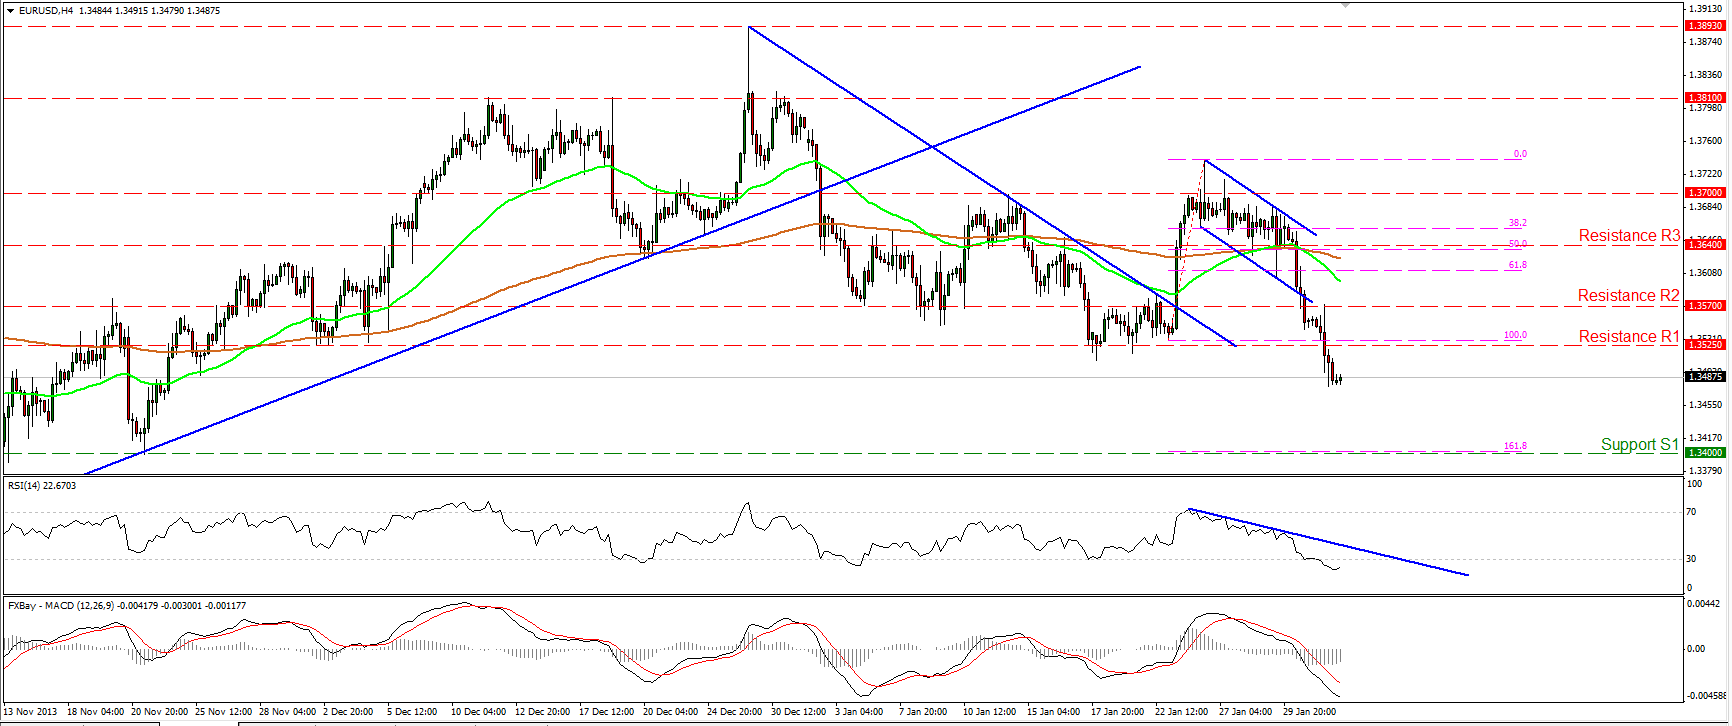
The EUR/USD moved significantly lower, breaking below the 1.3525 hurdle. The pair retraced the whole rally of Jan 23rd and is now heading towards support barrier of 1.3400 (S1), which coincides with the 161.8% Fibonacci extension level of the aforementioned advance. The MACD oscillator lies below both its trigger and signal lines, confirming the recent bearish momentum of the price action. However, the RSI entered its oversold territory, thus some price consolidation or an upward corrective wave upon the oscillator's exit from the extreme conditions cannot be ruled out.
Support: 1.3400 (S1), 1.3300 (S2), 1.3220 (S3).
Resistance: 1.3525 (R1), 1.3570 (R2), 1.3640 (R3).
 USD/JPY Hourly Chart" title="USD/JPY Hourly Chart" width="452" height="190">
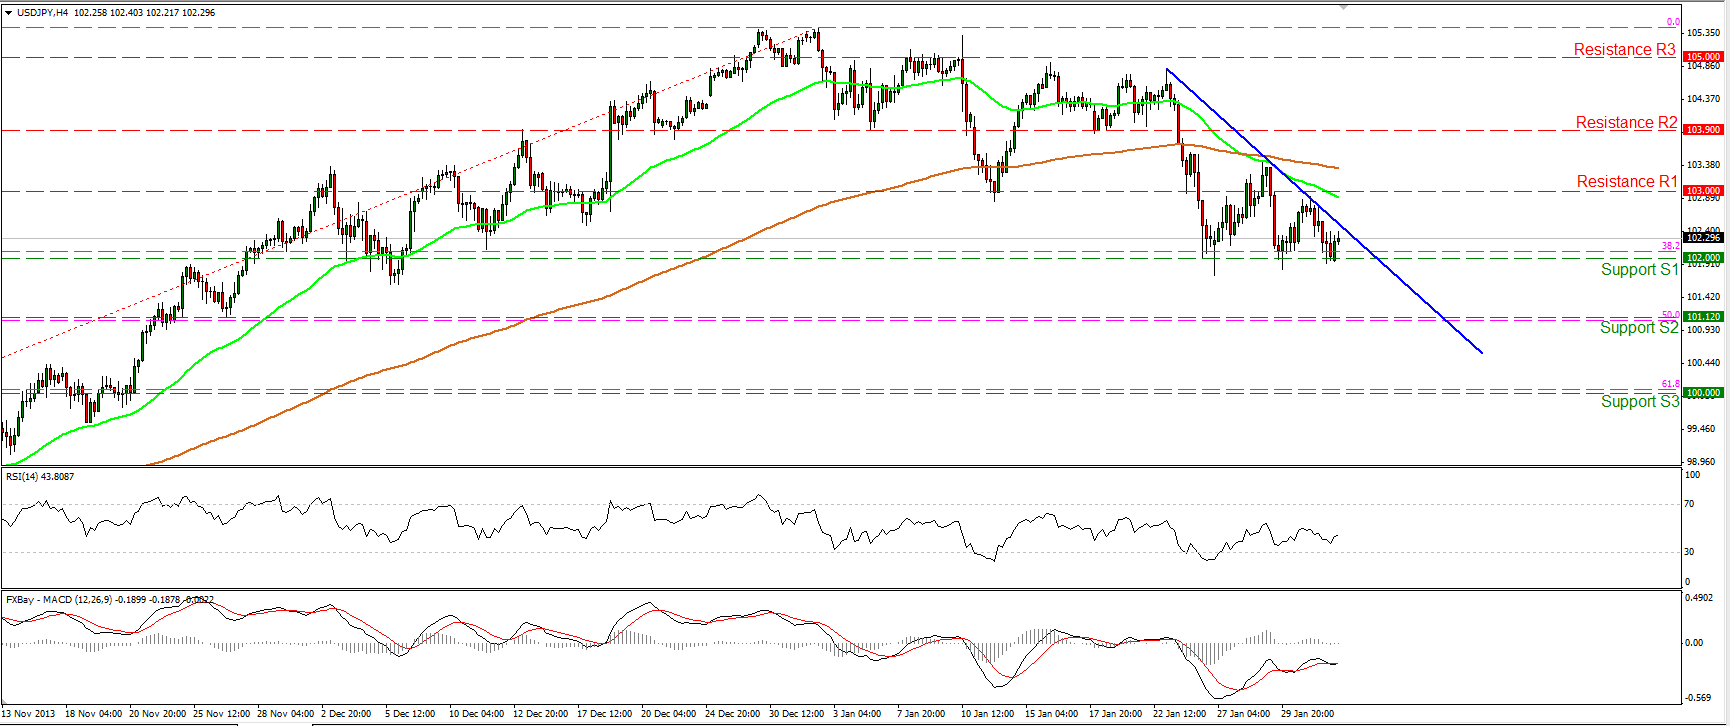
The USD/JPY rebounded for a third time from the 102.00 (S1) area, near the 38.2% Fibonacci retracement level of the 8th Oct. - 2nd Jan. advance. However, since the rate is trading below both the moving averages and the blue resistance line, the outlook remains negative. A clear violation of the aforementioned support area may drive the battle towards the next barrier at 101.12 (S2), near the 50% retracement level of the 8th Oct. - 2nd Jan. advance. On the longer-term time frames I still consider the short term downtrend as a retracement of the major upward path.
Support: 102.00 (S1), 101.12 (S2), 100.00 (S3)
Resistance: 103.00 (R1), 103.90 (R2), 105.00 (R3).
 EUR/GBP Hourly Chart" title="EUR/GBP Hourly Chart" width="452" height="189">
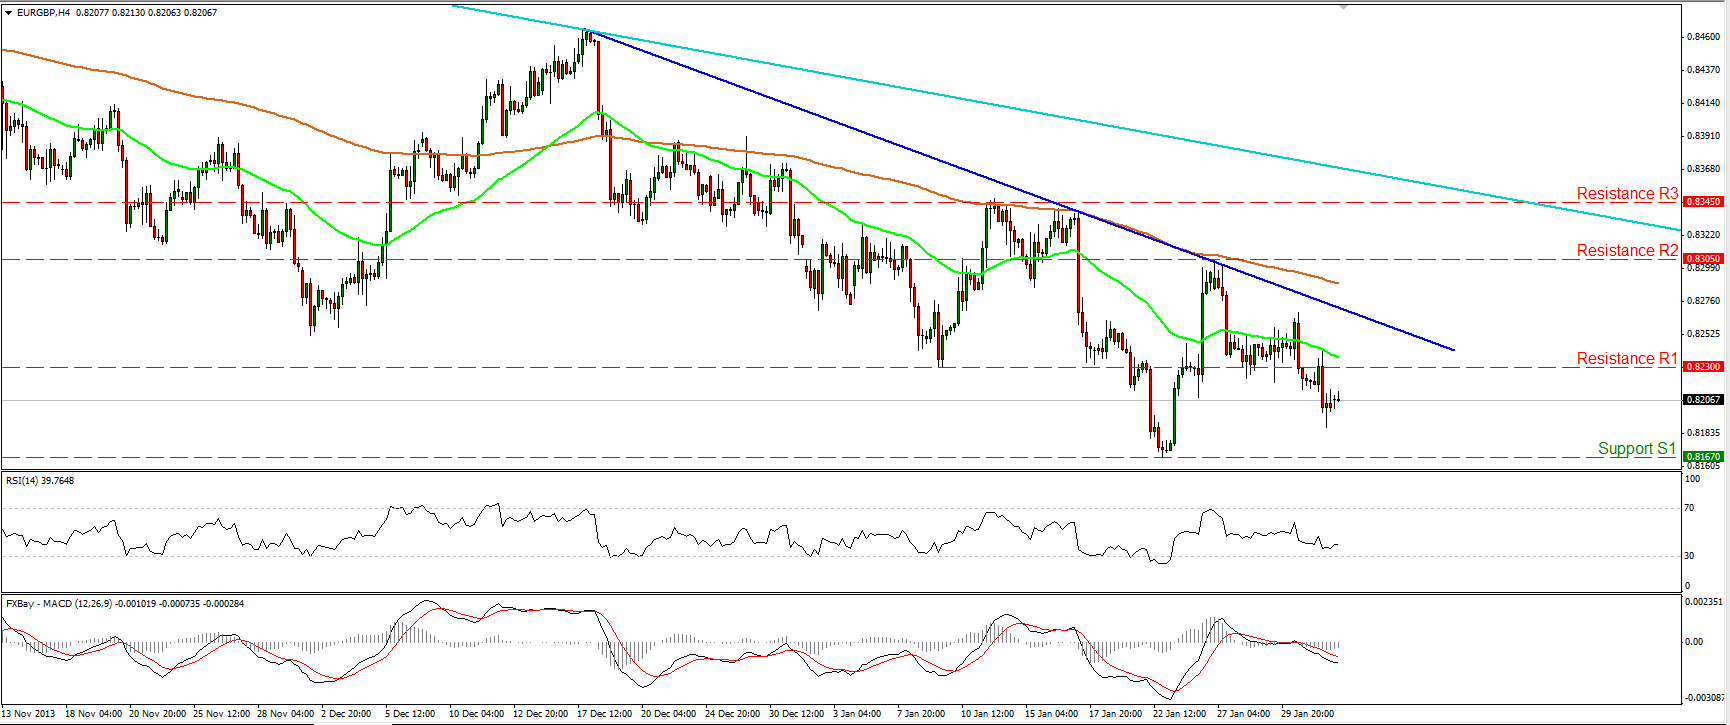
The EUR/GBP moved slightly lower, remaining between the support of 0.8167 (S1) and the resistance at 0.8230 (R1). If the bears are strong enough to continue pushing the price lower, I would expect them to challenge the support hurdle at 0.8167 (S1), the violation of which may open the way towards the next support at 0.8080 (S2). As long as the rate is trading below both the moving averages and the blue short-term resistance line, the outlook remains negative. Only an upward violation of the resistance line and the 0.8305 (R2) obstacle may change the rate's picture.
Support: 0.8167 (S1), 0.8080 (S2), 0.8035 (S3).
Resistance: 0.8230 (R1), 0.8305 (R2), 0.8345 (R3).
Gold

Gold remained near its Friday opening levels, consolidating below the 1250 (R1) level. A clear dip below the 1235 (S1) support may confirm that the 19th Dec. - 27th Jan advance was just a retracement of the major downtrend. Both momentum studies follow downward paths, while the MACD lies below both its zero and its trigger lines. On the other hand, only a break above the hurdle of 1268 (R2) may turn the picture positive again. On the daily chart, a bearish engulfing candlestick pattern is identified, suggesting the continuation of the decline.
Support: 1235 (S1), 1220 (S2), 1187 (S3).
Resistance: 1250 (R1), 1268 (R2), 1290 (R3).
Oil

WTI was unable to remain above the 97.85 barrier and moved lower, breaking below the blue uptrend line and confirming the negative divergence between our momentum studies and the price action. Nonetheless only a clear dip below the support level of 96.50 (S1) would turn the picture negative, since the possibility for a higher low still exists. The price is also testing the 50-period moving average, keeping alive the scenario for a rebound. I remain neutral on WTI for now until we have a clearer picture.
Support: 96.50 (S1), 95.00 (S2), 93.30 (S3).
Resistance: 97.85 (R1), 98.90 (R2), 100.55 (R3).
BENCHMARK CURRENCY RATES - DAILY GAINERS AND LOSERS
MARKETS SUMMARY
