
The dollar turned in a mixed performance overnight as global stock markets turned negative and risk aversion set in, sending the growth-sensitive currencies down against the dollar while boosting the yen. SEK and NZD were the largest decliners. The CAD ran counter to the trend though ahead of today’s retail sales figure, which are expected to show a turnaround from the previous month’s decline. A tentative buyout deal for Blackberry may also have boosted the Canadian currency. The dollar gained against most EM currencies, although MXN and BRL managed to gain.
It appears that we have seen the lows in the dollar for now following last week’s Fed shock. It’s noticeable that despite the better-than-expected composite PMI for the Eurozone yesterday, EUR/USD has moved back below 1.3500, for example. This even though US Treasury yields have come down by some 15 bps from right before the Fed news (and down 30 bps from the peak in early September). The lower rates should be supporting stock markets and growth-sensitive currencies. But the various Fed speakers who have spoken after the recent FOMC meeting have expressed such a wide variety of views about the economy and the likely start of tapering that confusion, not confidence, seems to be the main result. Moreover, there is still the possibility of another lurch downward in the dollar as the struggle over the US budget goes down to the wire. New York Fed President William Dudley said the obvious yesterday: that fiscal uncertainties “loom very large” as the US Congress tries to avoid a government shutdown and raise the nation’s debt ceiling. If that happens, there would no doubt be a huge risk-aversion trade. Thus the lack of a clear trend. I expect that the budget problem will be solved, as usual, and the growth trade will win out for now. That would tend to favour buying AUD and NZD against USD or JPY, or selling USD/SEK or USD/CAD.
There is an incredible slate of central bank speakers today: five ECB, four Bank of England, two Fed and one Bank of Canada speakers. If the recent Fed speakers are any guide, we can expect considerable volatility as they contradict one another. As for the data, the main event in Europe today is the Ifo survey for September. Both the current assessment and the expectations indices are expected to be higher, which may support EUR/USD. In the US, we have the Case/Shiller and Federal Housing Finance Agency house price indices, both of which are expected to show a rise in house prices at around the same pace as in the previous month. That would demonstrate that higher rates aren’t dampening the housing market and therefore would be bullish USD. On the other hand, there are some potentially USD-negative indicators as well. The Richmond Fed manufacturing index and the Conference Board consumer confidence index are both expected to fall. In Canada, retail sales for July are forecast to show a rise, a turnaround from the previous month.
The Market
EUR/USD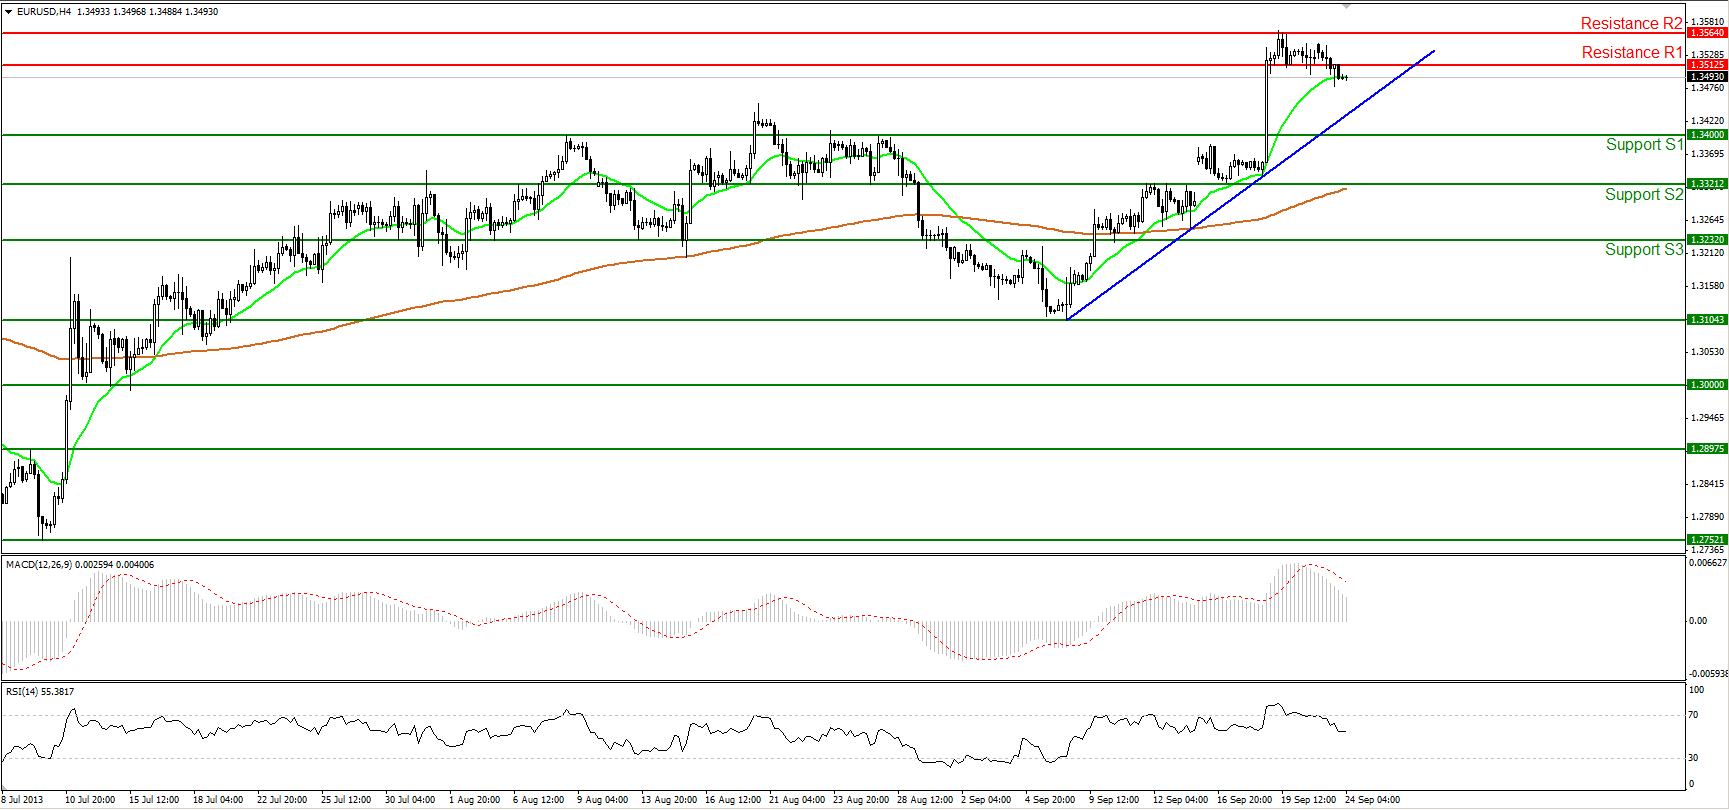 EUR/USD" border="0" height="810" width="1729">
The EUR/USD moved lower and managed to break below the 1.3512 level (yesterday’s support), confirming the weakness provided by our oscillators in yesterday’s analysis. Currently the pair is testing the 20-period moving average and a cross below it should indicate the continuation of the pullback towards the blue uptrend line or further down to the critical level of 1.3400 (S1). However, I still consider the rate moving in an uptrend since it is trading above the uptrend line and the moving averages still hold a bullish cross.
• Support is found at the well tested level of 1.3400 (S1), followed by 1.3321 (S2) and 1.3232 (S3)
• Resistance levels are the level of 1.3512 (R1), followed by 1.3564 (R2) and 1.3706 (R3). The latter two are found from the daily chart.
USD/JPY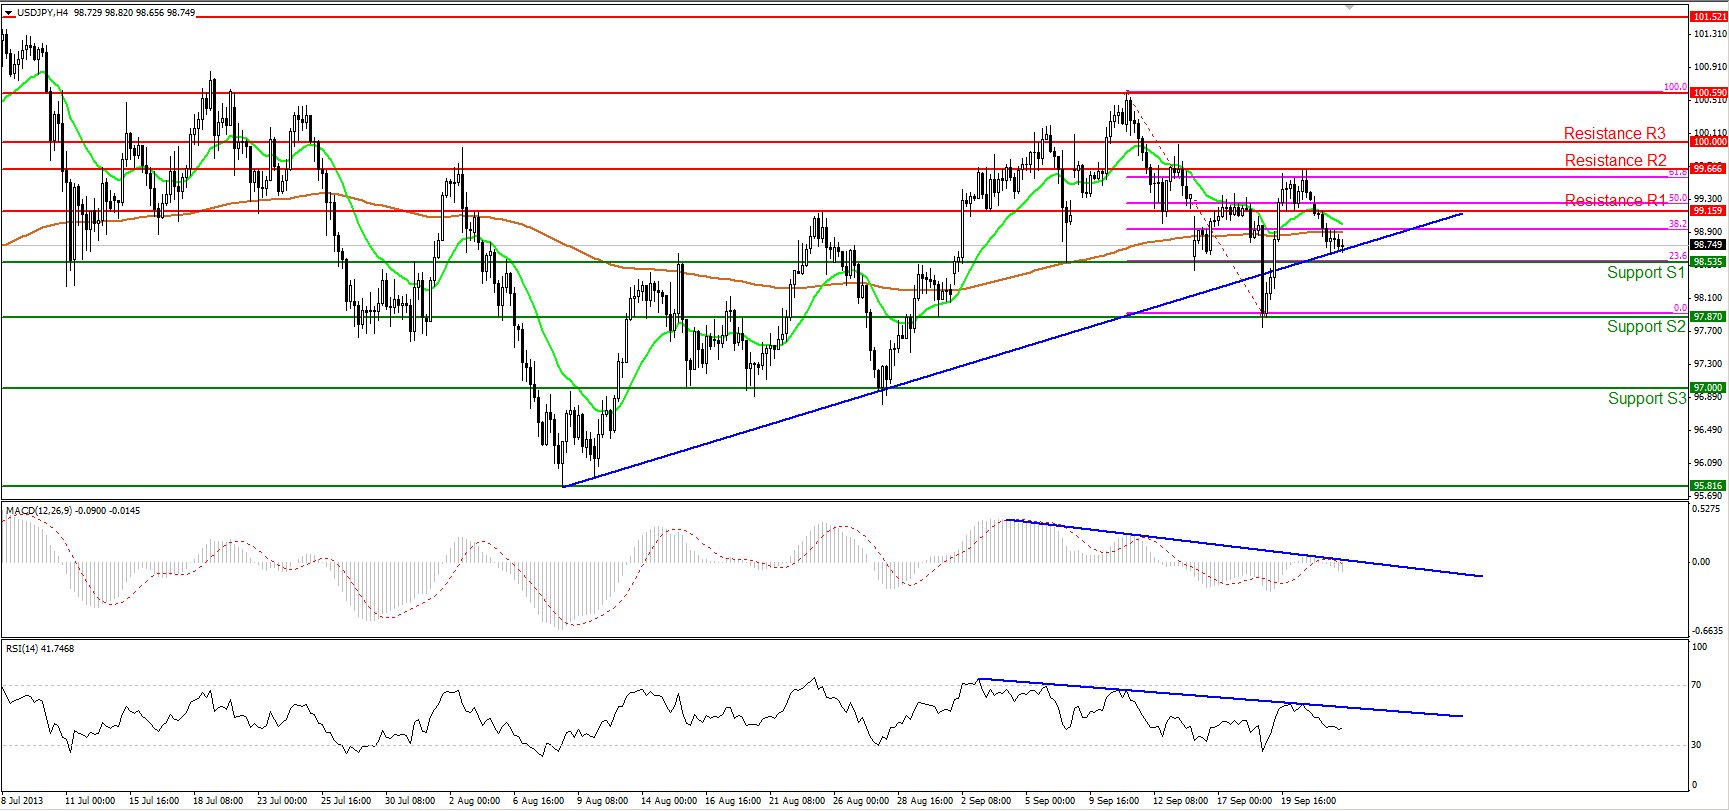 USD/JPY" border="0" height="811" width="1729">
The USD/JPY found resistance near the 61.8% Fibonacci retracement level of the 11th-18th Sept. wave and moved lower breaking below the 99.15 level (today’s resistance). At the time of writing the pair is testing the blue uptrend line and if the bears manage to drive the price below it and break the support of 98.52 (S1), we should concern for trend reversal signals. Both the RSI and MACD oscillators are moving downwards, increasing the odds for further downward movement.
• Support levels are at 98.53 (S1), followed by 97.87 (S2) and 97.00 (S3).
• Resistance is identified at 99.15 (R1), followed by 99.66 (R2) and the psychological round number of 100.00(R3).
EUR/GBPEUR/GBP" title="EUR/GBP" src="https://d1-invdn-com.akamaized.net/content/picacd13b65ed44332d7b12ce8eed24146a.PNG" height="527" width="791">
The EUR/GBP moved lower yesterday, after finding resistance at the 0.8462 (R2) level and slipped below the support level of 0.8422 (today’s resistance).During the European morning though, bulls regained some momentum, not letting the rate form a low lower than the previous one. If they continue moving the pair to the upside and break once more above the 0.8422 (R1), I expect the correcting phase I mentioned in previous comments to continue.
• Support levels are identified at 0.8355 (S1), 0.8324 (S2) and 0.8270 (S3) respectively. The latter two are found from the daily chart.
• Resistance is found at the levels of 0.8422 (R1), followed by 0.8462 (R2) and 0.8504 (R3).
Gold
Gold managed to break once more above the upper boundary of the downtrend channel, forming a higher low. At the European opening the yellow metal is trading between the 1316 (S1) and 1335 (R1) levels and a break above the second one should enhance my suspicions that the downtrend might have come to an end. Both the RSI and the MACD oscillators lie in relatively neutral levels, providing no clues for the next directional movement of the precious metal.
• Support levels are at 1316 (S1), followed by 1291 (S2) and 1273 (S3).
• Resistance is identified at the 1335 (R1) level, followed by 1368 (R2) and 1394 (R3).
Oil
WTI continued testing the lower boundary of the downtrend channel. If the price manage to rebound at that level and breaks above the 103.49 (R1) resistance, a correction might begin towards further resistance areas. The RSI favors the aforementioned scenario since it tested successfully its 30 level and moved upwards. Nonetheless, WTI’s trend is still considered to be a downtrend since the price is still trading into the downward slopping channel and the 20-period moving average lies below the 200-period moving average.
• Support levels are at 102.23(S1), 100.65 (S2) and 99.12 (S3).
• Resistance levels are at 103.49 (R1), followed by 104.40 (R2) and 106.06 (R3).
BENCHMARK CURRENCY RATES - DAILY GAINERS AND LOSERS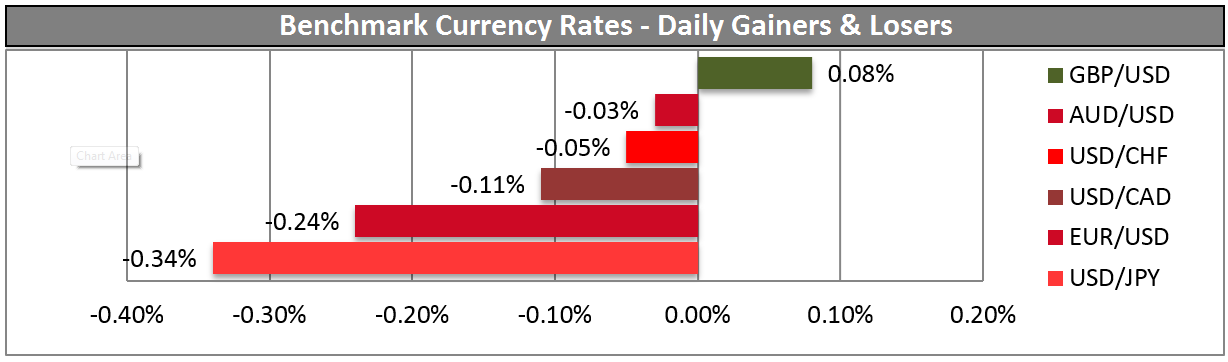
MARKETS SUMMARY: