
Earlier this week I posted a commentary Is This Bull Market Fundamentally Driven? A Look at PE Expansion. The content was largely reprinted from an analysis at the Wall Street Rant website. Among the many email responses I received about the post, one in particular stood out. Jonathan Schoolar, a long-time veteran of the investment industry, wrote:
Another, slightly less complicated way of looking at it is that bull markets go for as long as they go and for whatever reason. It is the terminal valuation that determines the degree of damage done in the subsequent bear market. Value must be reset, and the higher the starting point, the worse the decline when the bull driver ends.
Here is a quick look at the terminal Shiller P/E and subsequent declines using his info. Few data points but better "fit" than plotting the fundamental ratio. Bear markets from Shiller ratios above 20 are nasty.
Jonathan's email included a chart illustrating the cyclical P/Es at the peak before the 20% declines in the S&P 500 since its inception in March of 1957. Here is my annotated version of his chart. This is a scatter graph that uses the vertical axis to show the percent declines of the nine bear markets over this timeframe. The horizontal axis shows the cycle P/E ratio at the peak preceding the decline.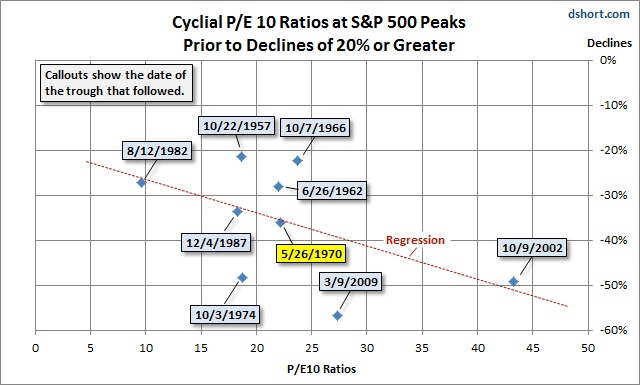
Because this type of graph doesn't show the chronology, I've used callouts to indicate the date of the trough (market low) following the peak. The regression is a linear "best fit" though the nine data points. Only four of the nine are tight fits to the regression. The three bear markets in the 1950s and '60s were less severe. The savage decline linked to the surge inflationary surge following the Arab Oil Embargo in 1973 was an outlier to the downside, as was the bear market associated with the Great Recession -- the one still vivid in our memories.
I highlighted the market trough in 1970 because the cyclical P/E ratio of its preceding peak in November of 1968 was 22.2. That's the same as the latest ratio in February of this year.
As Jonathan points out, "bull markets go for as long as they go and for whatever reason." As I type this, our current bull in the S&P 500 is just a few points, about half a percent, from a new all-time high. Mainstream market mavens are increasingly bullish on US equities. For example, on Monday, well-known analyst Meredith Whitney said, I have not been this constructive and bullish on US equities in my career. And of course we saw a cyclical P/E ratio north of 40 at the market peak in 2000.
At some point I hope to all another dot to the chart above. Where will it lie in the overall scatter? Only time will tell.
Appendix For Further Consideration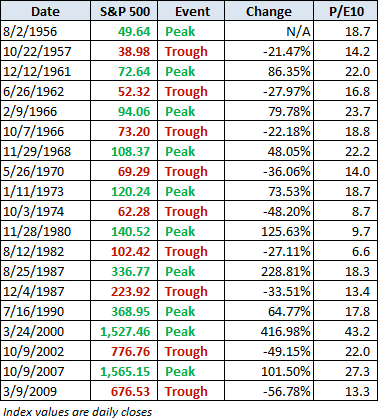
- English (UK)
- English (India)
- English (Canada)
- English (Australia)
- English (South Africa)
- English (Philippines)
- English (Nigeria)
- Deutsch
- Español (España)
- Español (México)
- Français
- Italiano
- Nederlands
- Português (Portugal)
- Polski
- Português (Brasil)
- Русский
- Türkçe
- العربية
- Ελληνικά
- Svenska
- Suomi
- עברית
- 日本語
- 한국어
- 简体中文
- 繁體中文
- Bahasa Indonesia
- Bahasa Melayu
- ไทย
- Tiếng Việt
- हिंदी
Cyclial P/E Ratios: Must Values Reset Before Bear Sets In?
Published 03/20/2013, 11:47 AM
Updated 07/09/2023, 06:31 AM
Cyclial P/E Ratios: Must Values Reset Before Bear Sets In?
Latest comments
Loading next article…
Install Our App
Risk Disclosure: Trading in financial instruments and/or cryptocurrencies involves high risks including the risk of losing some, or all, of your investment amount, and may not be suitable for all investors. Prices of cryptocurrencies are extremely volatile and may be affected by external factors such as financial, regulatory or political events. Trading on margin increases the financial risks.
Before deciding to trade in financial instrument or cryptocurrencies you should be fully informed of the risks and costs associated with trading the financial markets, carefully consider your investment objectives, level of experience, and risk appetite, and seek professional advice where needed.
Fusion Media would like to remind you that the data contained in this website is not necessarily real-time nor accurate. The data and prices on the website are not necessarily provided by any market or exchange, but may be provided by market makers, and so prices may not be accurate and may differ from the actual price at any given market, meaning prices are indicative and not appropriate for trading purposes. Fusion Media and any provider of the data contained in this website will not accept liability for any loss or damage as a result of your trading, or your reliance on the information contained within this website.
It is prohibited to use, store, reproduce, display, modify, transmit or distribute the data contained in this website without the explicit prior written permission of Fusion Media and/or the data provider. All intellectual property rights are reserved by the providers and/or the exchange providing the data contained in this website.
Fusion Media may be compensated by the advertisers that appear on the website, based on your interaction with the advertisements or advertisers.
© 2007-2024 - Fusion Media Limited. All Rights Reserved.