In the first half of this column, I looked at the long-leading, leading and coincident indicators, along with commodity prices and asset markets to determine if the standard causes of a recession exist. I concluded they do not. Here, I’ll look at several components of GDP to determine if there is any existence of potential slowdown.
Let’s start with consumer spending. The following scatter plot graphs the Y/Y percentage change in retail sales and payroll growth:
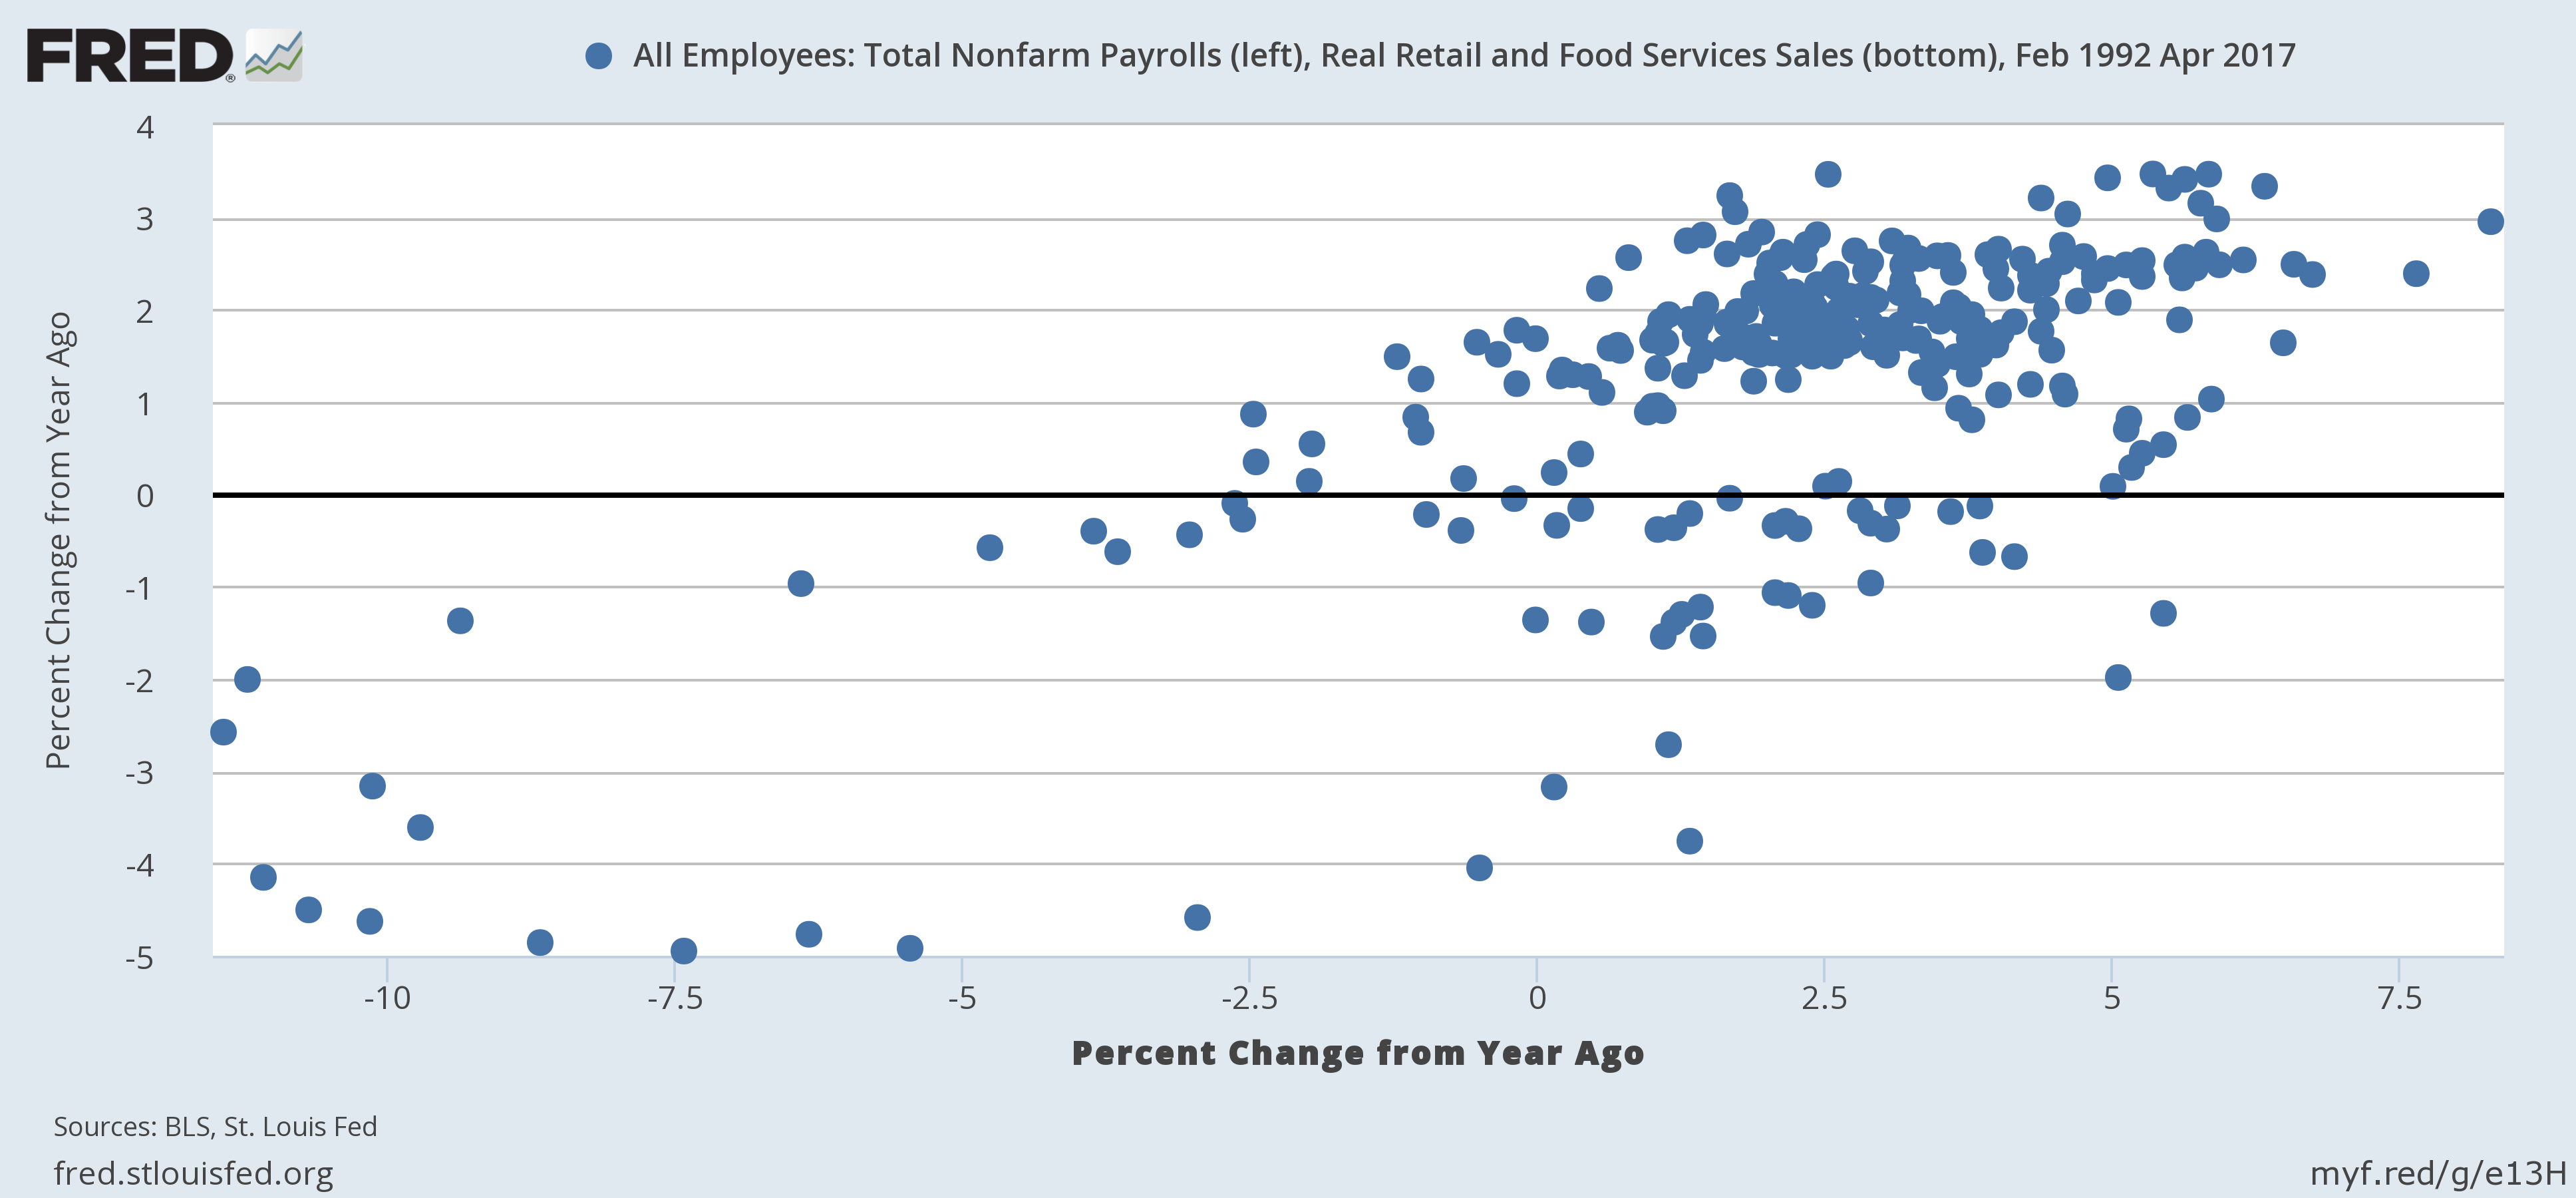
These two variables have a .68 correlation, indicating a fairly strong relationship. Therefore, we can conclude retail sales growth – and the broader category of personal consumption expenditures – should continue so long as job growth continues to rise.
However, it does appear that job growth is slowing:
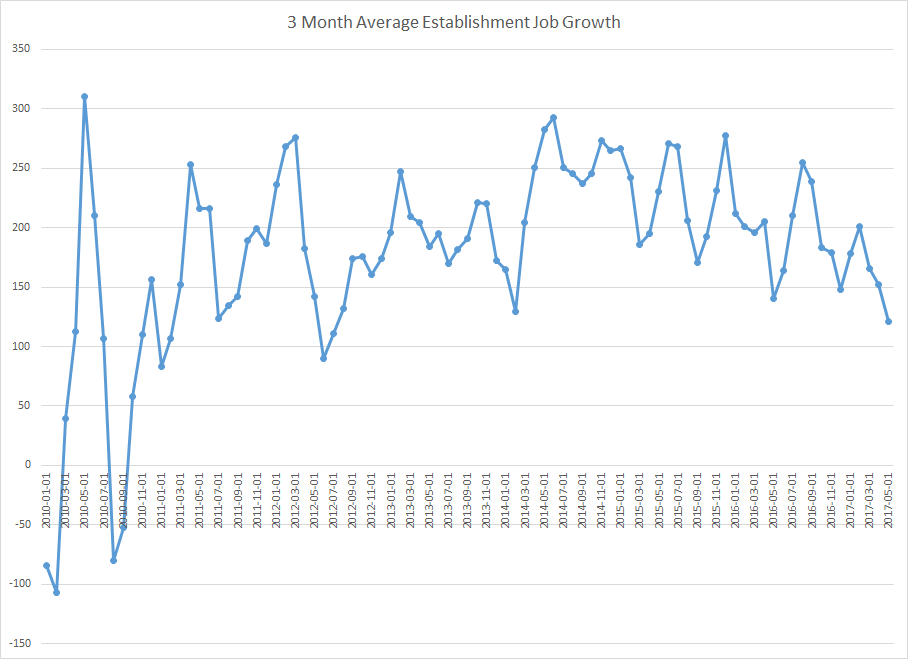
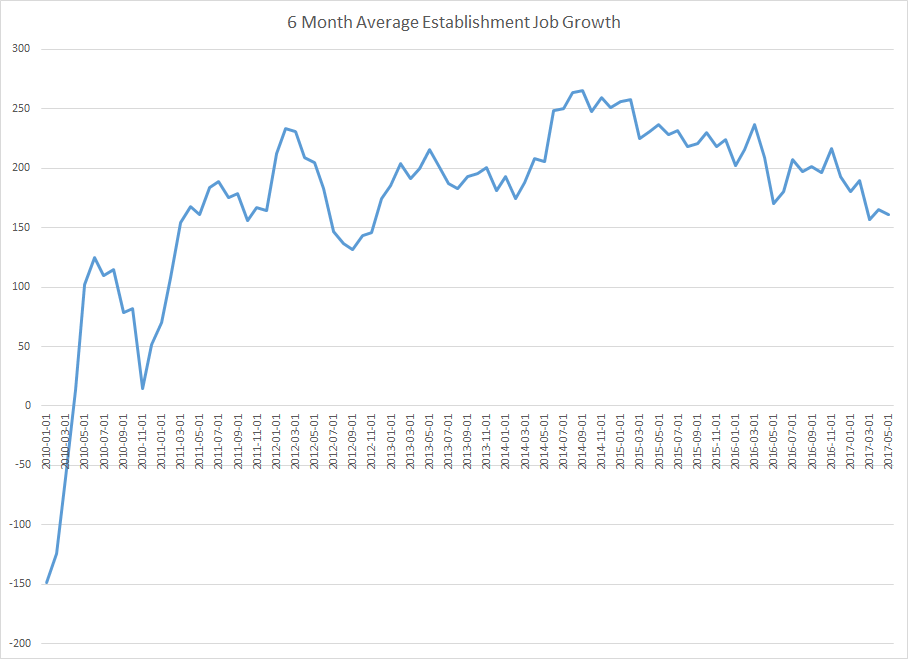
The top chart shows the rolling 3-month rate of establishment job growth while the bottom chart shows the 6-month figure. Even though both are still positive, their respective rates of change is decreasing. In several recent speeches, Fed governors have unanimously argued this slowdown indicates the job market is near full employment. The 4-week average of unemployment claims confirms this assessment:
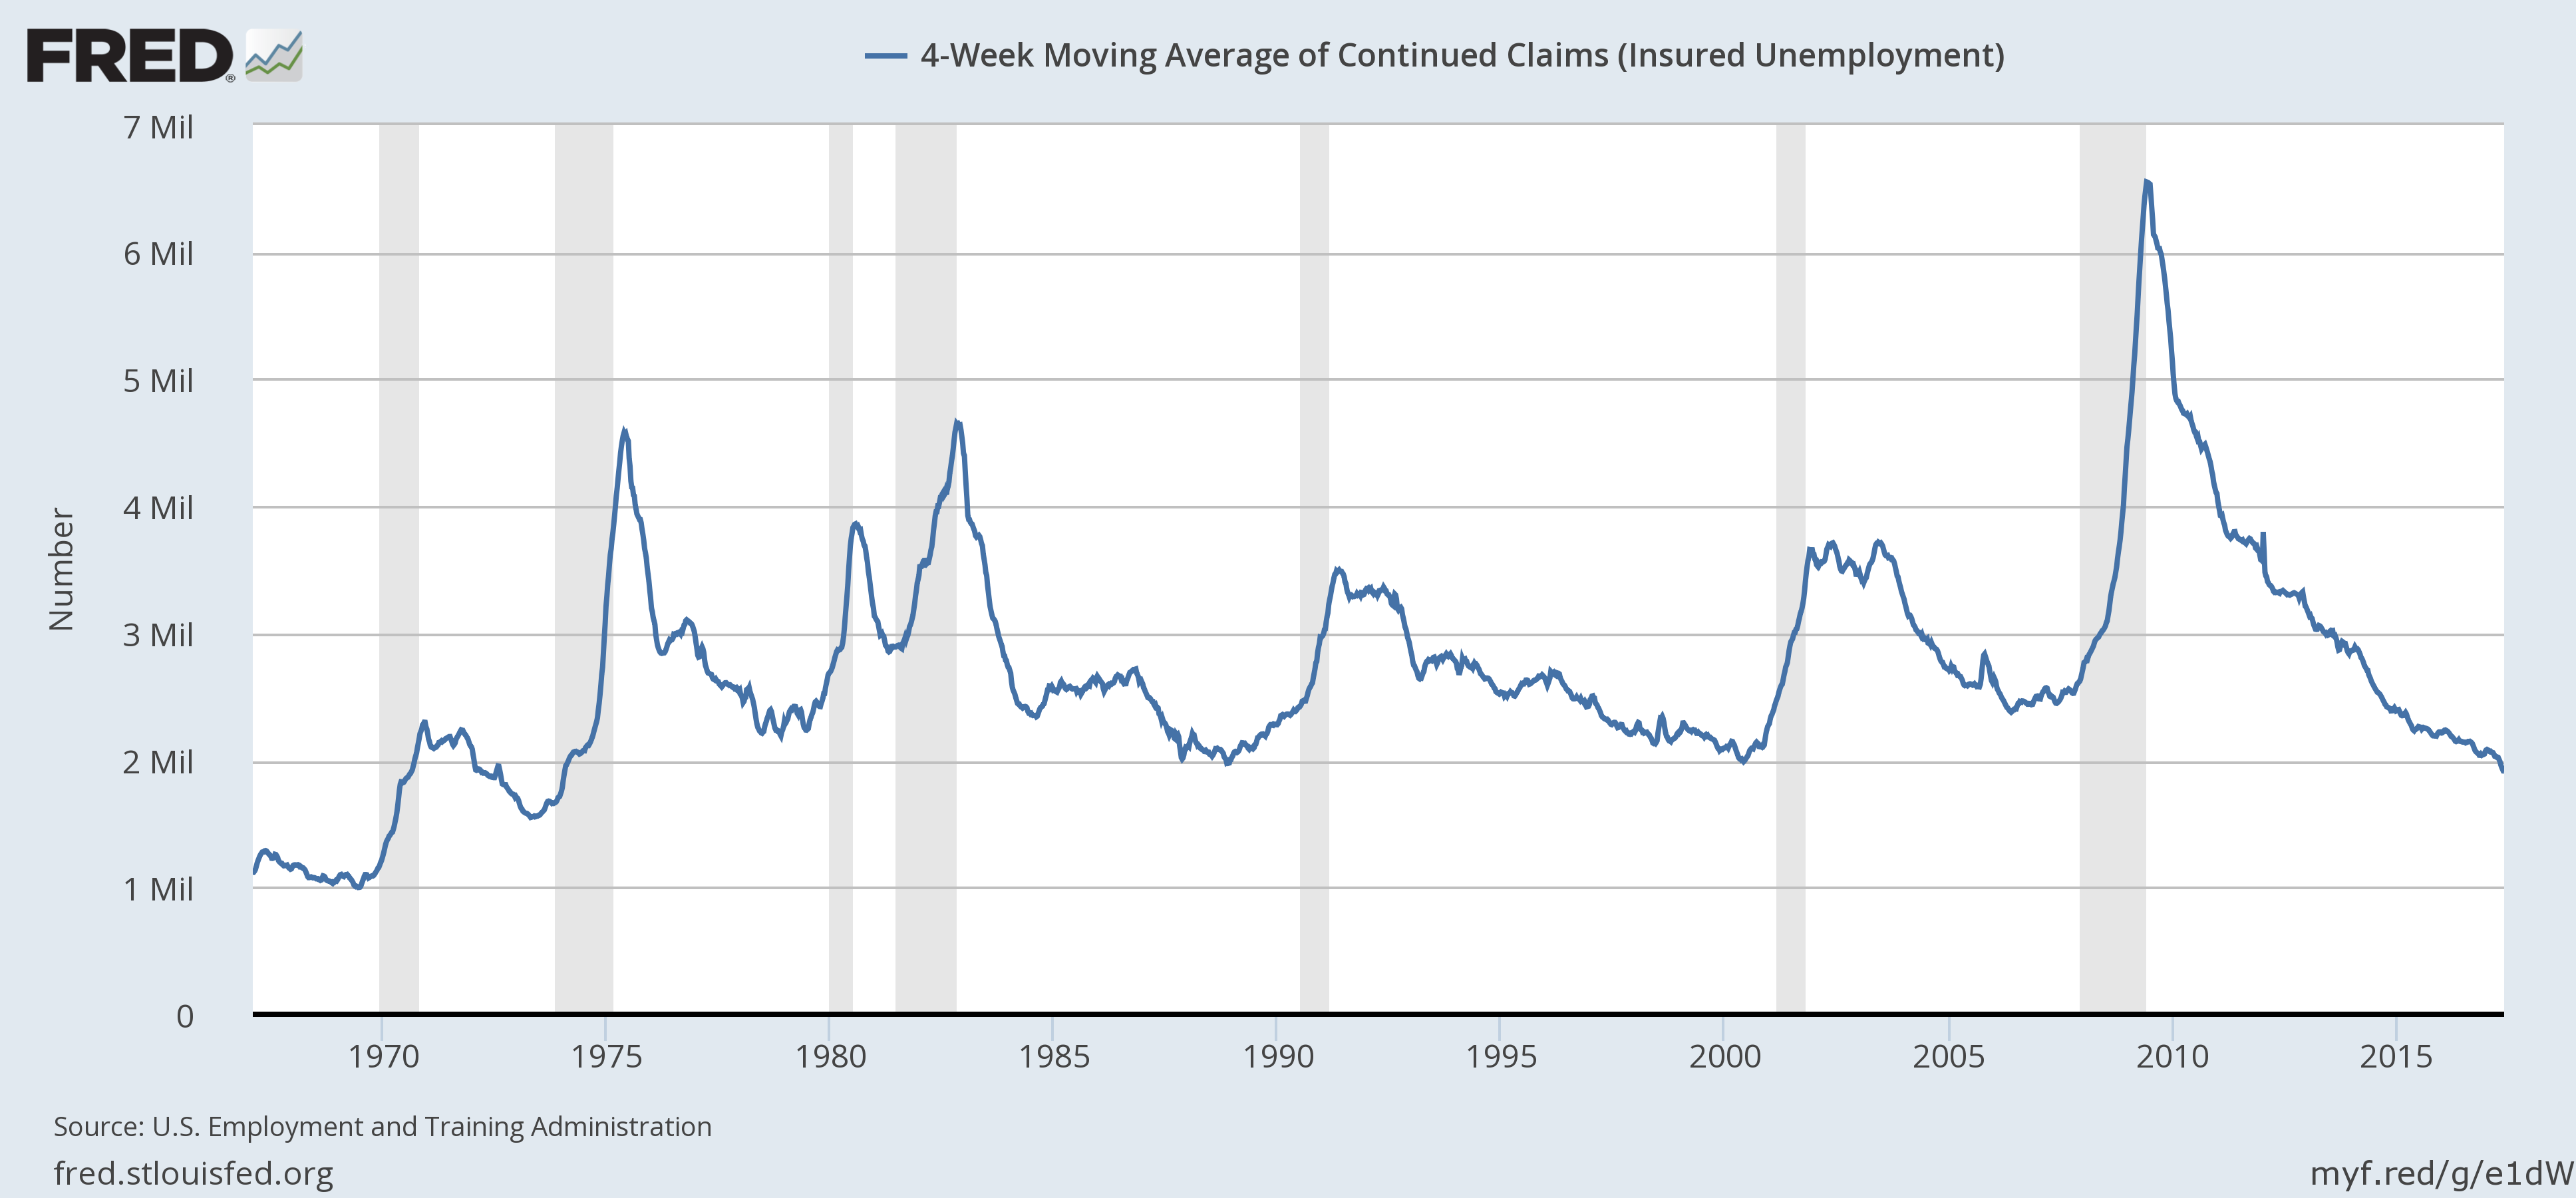
Claims start rising at least 6 months before a recession. Currently, they are decreasing. Concluding the analysis of consumer spending, so long as job growth remains positive, consumer spending should continue. As this represents 70% of economic growth, this is a very important conclusion.
Turning to business, we start with this chart of capacity utilization:
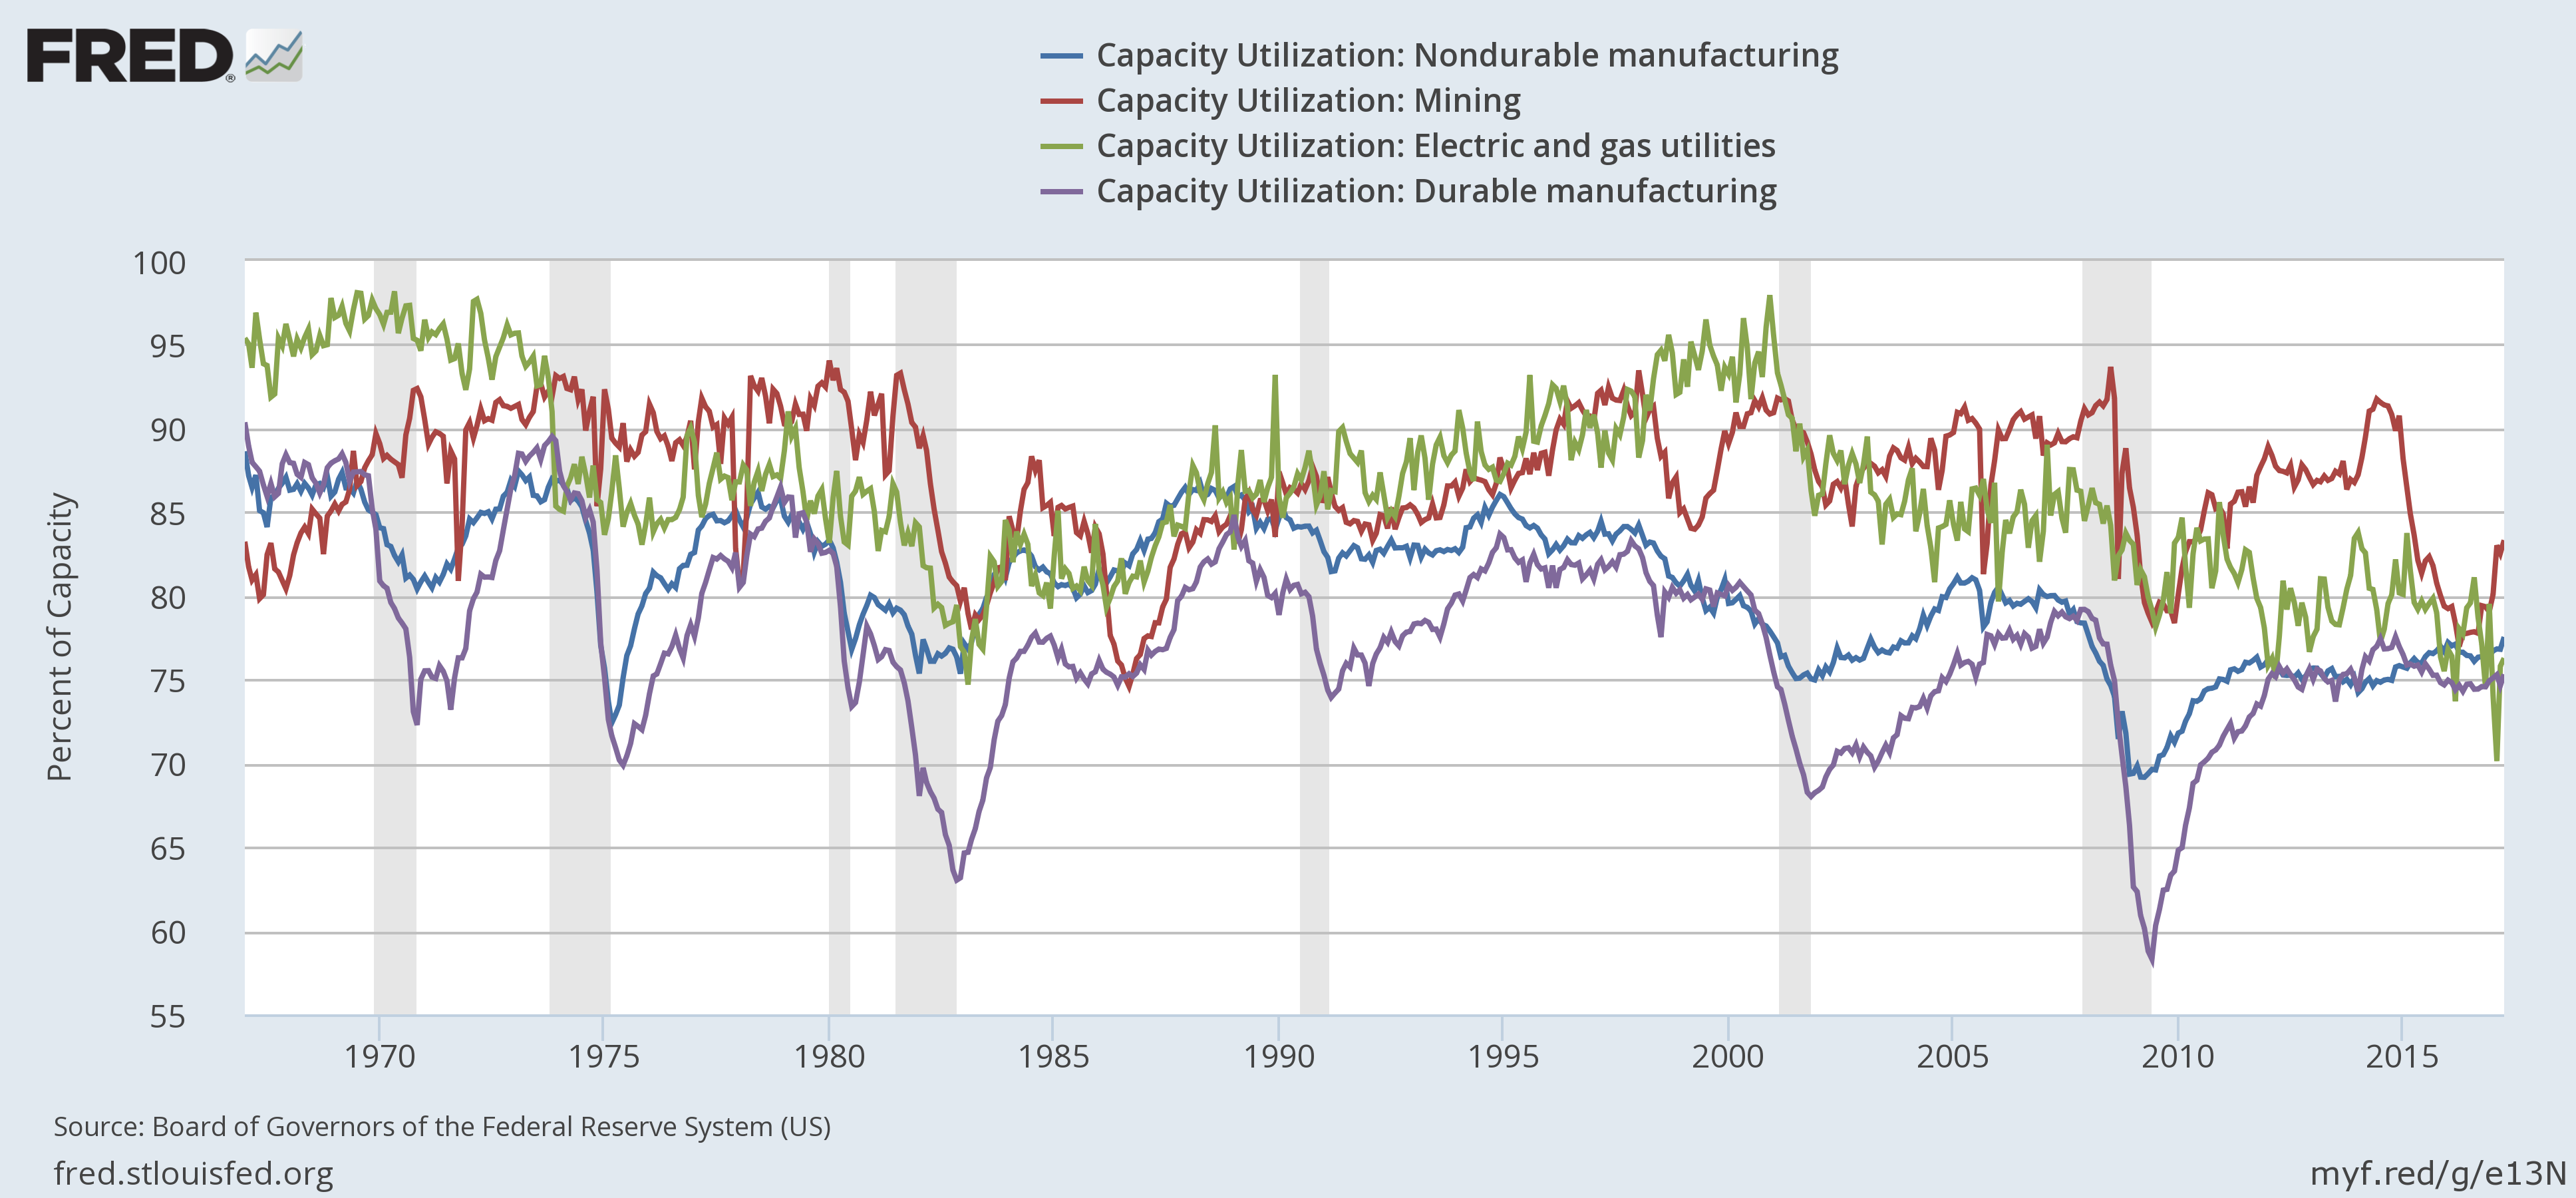
Since the end of the 1990s, capacity utilization for all 4 major areas of industrial activity has decreased. This explains why the overall pace of investment has been weaker during the last 2 expansions:
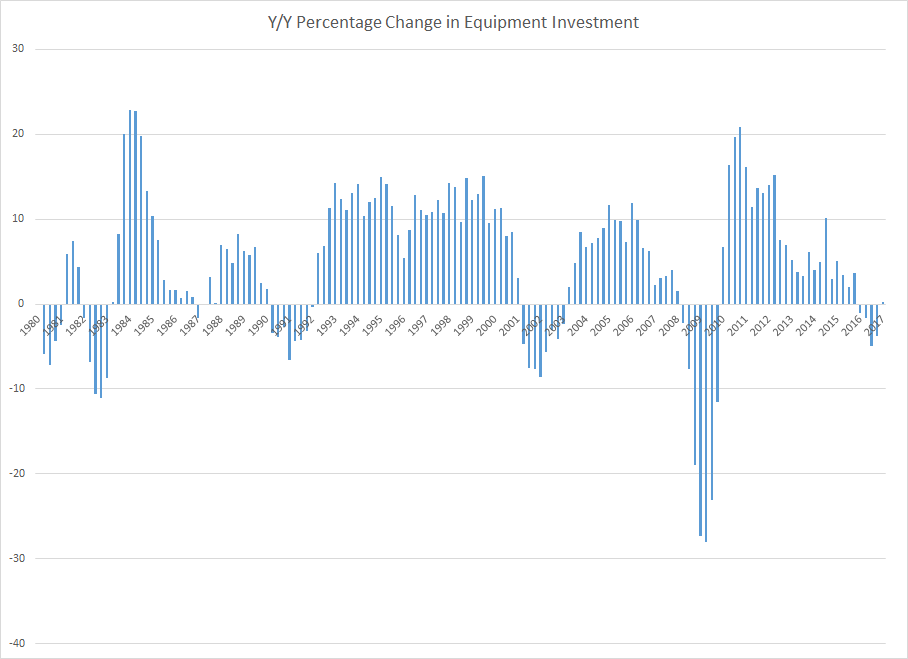
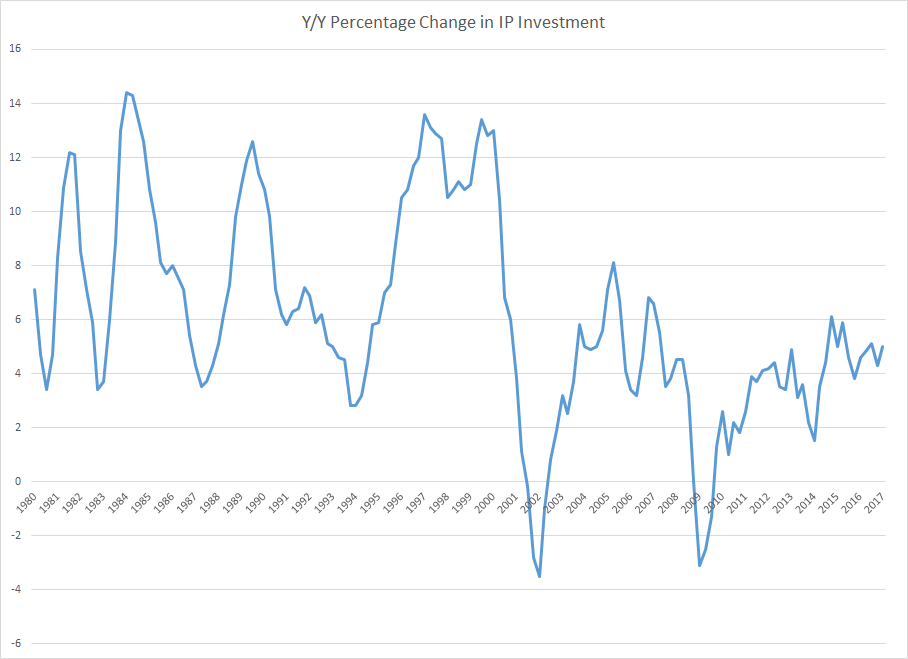
The two charts above show the respective Y/Y percentage change in equipment and intellectual property investment. Both show a declining rate of investment. Non-residential structural investment increased strongly at the end of the last expansion indicating commercial real estate participated in the housing bubble. During this recession, CRE investment has vacillated between spiking investment and slower growth. However, what all three charts show is that, while business is investing, they are doing so at a historically lower rate. Some of this is due to lower capacity utilization.
The final category of investment is residential:
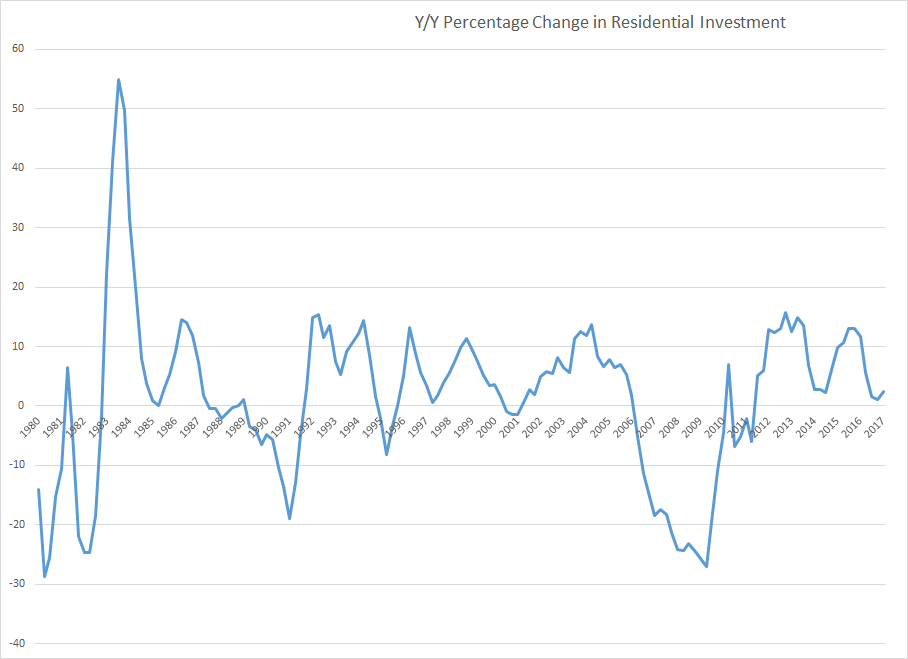
This metric has clearly healed from the housing bubble.
While Trump promised to engage in massive infrastructure spending – along with tax reform, it’s looking more and more doubtful either will occur. Exports – which are about 13% of total GDP – will add to growth around the margins. Despite the political rhetoric that America will now become an export juggernaut, Trump’s near incompetence will probably doom that prospect.
