
Cummins Inc.’s (NYSE:CMI) adjusted earnings per share decreased 5.6% to $2.02 in the third quarter of 2016 from $2.14 earned in the year-ago quarter. The bottom line, however, surpassed the Zacks Consensus Estimate of $1.93. Including the impact of one-time items, net income fell to $289 million from $380 million in the third quarter of 2015.
Revenues declined 9% year over year to $4.19 billion in the reported quarter. Moreover, the figure missed the Zacks Consensus Estimate of $4.26 billion. The year-over-year decline was due to lower truck production in North America and weak international demand for power generation equipment.
Operating income decreased significantly to $384 million from $557 million a year ago. Earnings before interest and taxes (“EBIT”) dropped to $398 million (9.5% of sales) from $577 million (12.5% of sales) a year ago.
Segment Performance
Sales in the Engine segment fell 12% to $1.9 billion due to a 13% decline in on-highway revenues, resulting from weaker heavy and medium-duty truck production in North America. The segment’s EBIT decreased to $89 million (4.8% of sales) from $217 million (10.3% of sales) a year ago.
Sales at the Components segment fell 8% to $1.1 billion owing to lower sales in North America, attributable to lower medium and heavy-duty truck production, partially offset by higher revenues in China. This segment’s EBIT declined to $148 million (12.9% of sales) from $156 million (12.6% of sales) in the prior-year quarter.
Sales at the Power Systems segment fell 13% to $856 million due to a drop in demand for power generation equipment and industrial engines in Asia, the Middle East and Africa. The segment’s EBIT declined to $59 million (6.9% of sales) in third-quarter 2016 from $74 million (7.5% of sales) in third-quarter 2015.
Sales at the Distribution segment dropped 3% to $1.5 billion. Revenues benefited from the company’s acquisitions undertaken. However, this gain was offset by adverse currency movements and lower organic sales. The segment’s EBIT fell to $96 million (6.4% of sales) from $123 million (7.9% of sales) a year ago.
Financial Position
Cummins’ cash and cash equivalents decreased to $1.25 billion as of Oct 2, 2016, from $1.71 billion as of Dec 31, 2015. Long-term debt totaled $1.63 billion as of Oct 2, 2016, compared with $1.62 billion as of Dec 31, 2015.
In the first nine months of 2016, Cummins’ net operating cash flow increased to $1.31 billion from $1.13 billion in the same period a year ago. Capital expenditures decreased to $312 million from $393 million in the prior-year period.
Capital Deployment
Cummins is focused on enhancing shareholder value by pursuing aggressive share repurchases and increasing dividend payouts. The company returned $1.3 billion to shareholders in the first nine months of 2016 through dividends and share repurchases. This is consistent with Cummins’ plans to return 75% of its full-year operating cash flow to shareholders.
2016 Guidance
For 2016, Cummins expects its revenue to decline 9%, consistent with its prior guidance of a decline of 8%−10%. The EBIT guidance was reduced to 11.3% from the prior range of 11.6%–12.2% due to an increase in the expected costs of a loss contingency in the third quarter.
CUMMINS INC Price, Consensus and EPS Surprise
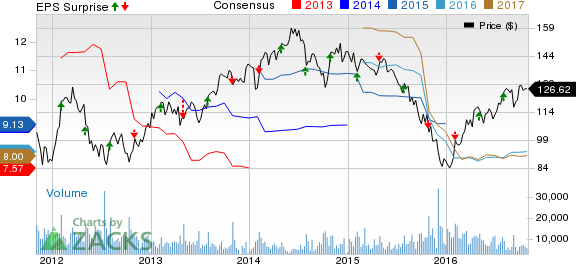
CUMMINS INC Price, Consensus and EPS Surprise | CUMMINS INC Quote
Zacks Rank
Currently, Cummins carries a Zacks Rank #2 (Buy).
Some other well-ranked stocks in the auto space include Spartan Motors Inc. (NASDAQ:SPAR) , Gentex Corp. (NASDAQ:GNTX) and Standard Motor Products Inc. (NYSE:SMP) .
Standard Motor has a long-term expected growth rate of 15%, better than the industry average of 12.30%. It sports a Zacks Rank #1 (Strong Buy). You can see the complete list of today’s Zacks #1 Rank stocks here.
Spartan Motors, carrying a Zacks Rank #2, has a long-term expected growth rate of 15%, compared to the industry average of 12%.
Gentex, also a Zacks Rank #2 stock, has a long-term expected growth rate of 11.20%.
Confidential from Zacks
Beyond this Analyst Blog, would you like to see Zacks' best recommendations that are not available to the public? Our Executive VP, Steve Reitmeister, knows when key trades are about to be triggered and which of our experts has the hottest hand. Click to see them now>>
GENTEX CORP (GNTX): Free Stock Analysis Report
SPARTAN MOTORS (SPAR): Free Stock Analysis Report
STANDARD MOTOR (SMP): Free Stock Analysis Report
CUMMINS INC (CMI): Free Stock Analysis Report
Original post
Zacks Investment Research