The nation’s third largest self-storage real estate investment trust (REIT) CubeSmart (NYSE:CUBE) stock is a steady gainer that should continue to see tailwinds from the pandemic recovery. The 3.95% annual dividend yield provides a nice buffer as it outperforms the benchmark S&P 500 index year-to-date (YTD). The industry has seen a recovery from consumers and businesses downsizing during the pandemic. States that are seeing an accelerated outflow of residents and closing of businesses like New York and California are notable areas of strength. The migration from cities to suburbs has fueled the housing boom. CubeSmart operates over 1,200 locations maintaining occupancy rates of 94%. The success of its fully automated digital rental platform SmartRental accounts for nearly 30% of rentals due to its frictionless convenient process where renters can lease units seamlessly online. Prudent investors looking for steady growth and income play can monitor shares of CubeSmart for opportunistic pullbacks.
Q3 FY 2020 Earnings Release
On Nov. 5, 2020, CubeSmart released its fiscal third-quarter 2020 results for the quarter ending September 2020. The Company reported an earnings-per-share (EPS) profit of $0.44 excluding non-recurring items versus consensus analyst estimates for a profit of $0.41, a $0.03 beat. Revenues grew 3.6% year-over-year (YoY) to $172.5 million beating analyst estimates for $166.66 million. Same-store occupancy closed the quarter at 94.3%. The Company didn’t provide guidance due to the uncertainty stemming from COVID-19.
Conference Call Takeaways
CubeSmart CEO, Christopher Marr, stated:
“Our physical occupancy remains at record-highs with same-store occupancy gap to last year expanding and ending October at a positive 211 basis points. Demand from high-quality customers remains extremely solid and our average length of stay continues to elongate.”
Marr noted the exceptionally strong demand trends in New York, as the Company acquired 8 stores in Brooklyn, Bronx and Queens from Storage deluxe. The Company also added 9 additional properties under contract in Long Island, Florida and Texas. The SmartRental platform accounts for 30% of the rentals. The Company launched the CubeSmart mobile app enabling customers to access gates codes, pay bills, manage settings and receive notifications. Collections and accounts receivables have returned to “normal historical levels” according to CubeSmart CFO, Timothy Martin. The Company added 37 new stores to their third-party management platform, where CubeSmart manages the property for the owners. By year-end, CubeSmart is under contract to close on the acquisition of 17 stores for an aggregate investment of $643.9 million.
Storage Stickiness
During the Q&A session, the topic of move-in and move-out activity was touched upon. Most customers are in a state of movement, but they tend to keep their belongings in storage longer as they acclimate to “lighter” possessions. CEO Marr summed it, “…the reality of our business is we cannot force somebody to stay once they have moved in. However, I think we have all discovered that it is an incredibly sticky business. Once one of our customers finds us and move in and starts to appreciate the joy of having a less crowded home environment and how self-storage can really assist in helping them with their life’s needs, they tend to stay.” He also noted that the average stay is around 14-months. They are also benefactors of “asset-light” lifestyles, as people wind down belongings and downsize living spaces and expenses.

CUBE Opportunistic Pullback Levels
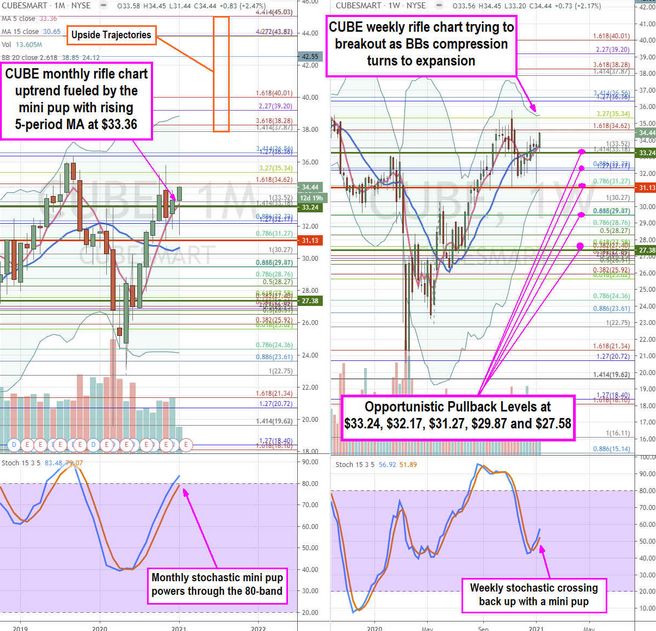
Using the rifle charts on the monthly and weekly time frames provides a broader view of the price action playing field for CUBE stock. The monthly rifle chart has been uptrending with the rising 5-period moving average (MA) just above the $33.18 Fibonacci (fib) level. The monthly stochastic continues its upward oscillation through the 80-band powered by a mini pup.
The weekly rifle chart completed its stochastic oscillation down and crossed back up with a rising 5-period MA at $33.73 powered by a stochastic mini pup. The weekly market structure low (MSL) buy triggers formed above $27.38 and $33.24, while the monthly market structure high (MSH) sell triggers under $31.13. Prudent investors can look for opportunistic pullback levels at the $34.24 weekly MSL trigger, $32.17 fib, $31.27 fib, $29.87 fib and the $27.58 fib cluster.
The upside trajectories range from the $37.87 fib up to the $45.03 fib. A covered call strategy can further improve annual returns in addition to the dividend yield. It’s prudent to keep an eye on peers Life Storage (NYSE:LSI) and National Storage Affiliates (NYSE:NSA) as they tend to move as a group.
