Cryptocurrency Long and Short Signal Analysis
· Point and Figure charting provides the most transparent and unambiguous view of the market.
· Price Action only charting eliminate the noise of news, volume, time, and sideways movement.
Ethreum (ETH/USD)

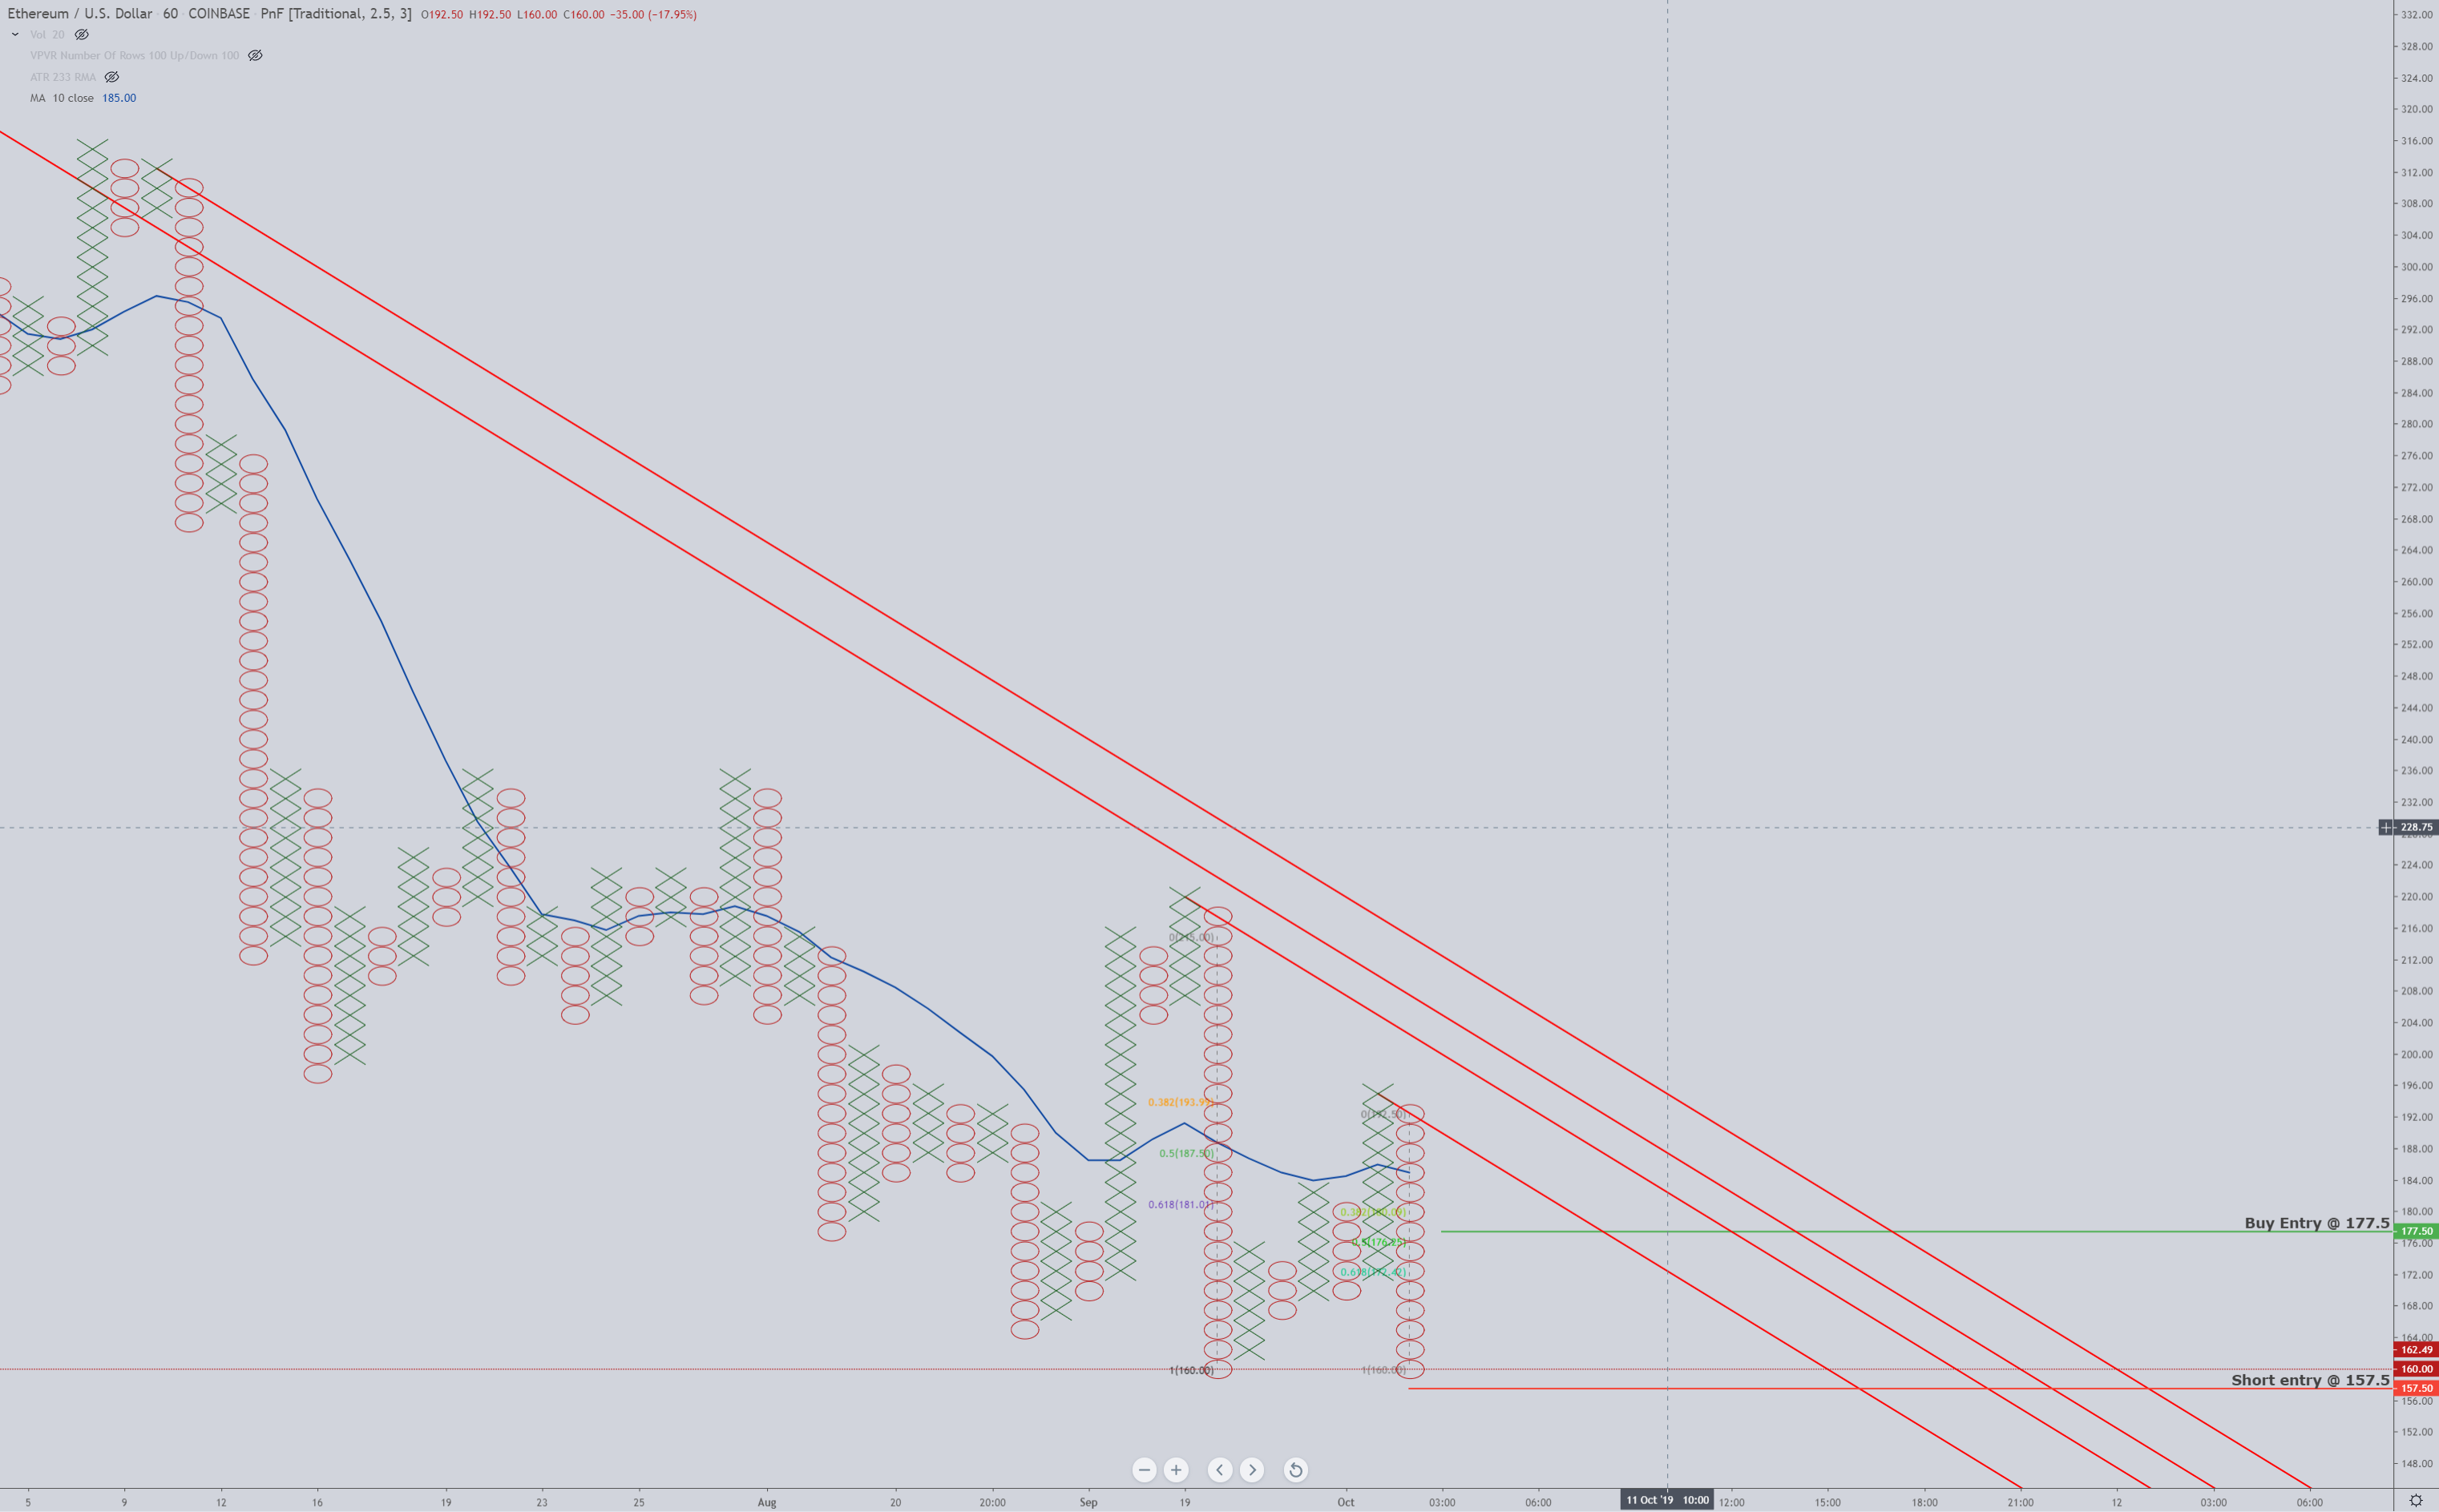
Ethereum’s current Point & Figure chart shows two essential conditions. The first is the current double bottom at $160. This is a split double bottom and is not an ideal condition for an entry, but because of the current downtrend, it does have a high probability of breaking. The short entry would be at a break of this double bottom at $157.50. I filter my trades on a point and figure chart according to two primary conditions. First is the overall bearish trend. It’s a very bearish condition with a cluster of 45-degree objective downtrend angles. The second filter is the location of the multiple tops or bottoms in relation to the moving average. To go short, both of the double bottoms or double tops would need to be above the moving average. The exception I give to my entry rules is when there is a spike or a pole pattern on the chart. The current column of Os has 14 boxes. This is less than a spike pattern but most definitely a pole pattern. An entry on a pole pattern when price moves above the 50% range of the pole. For Ethereum, that entry would be when price returns to $177.50.

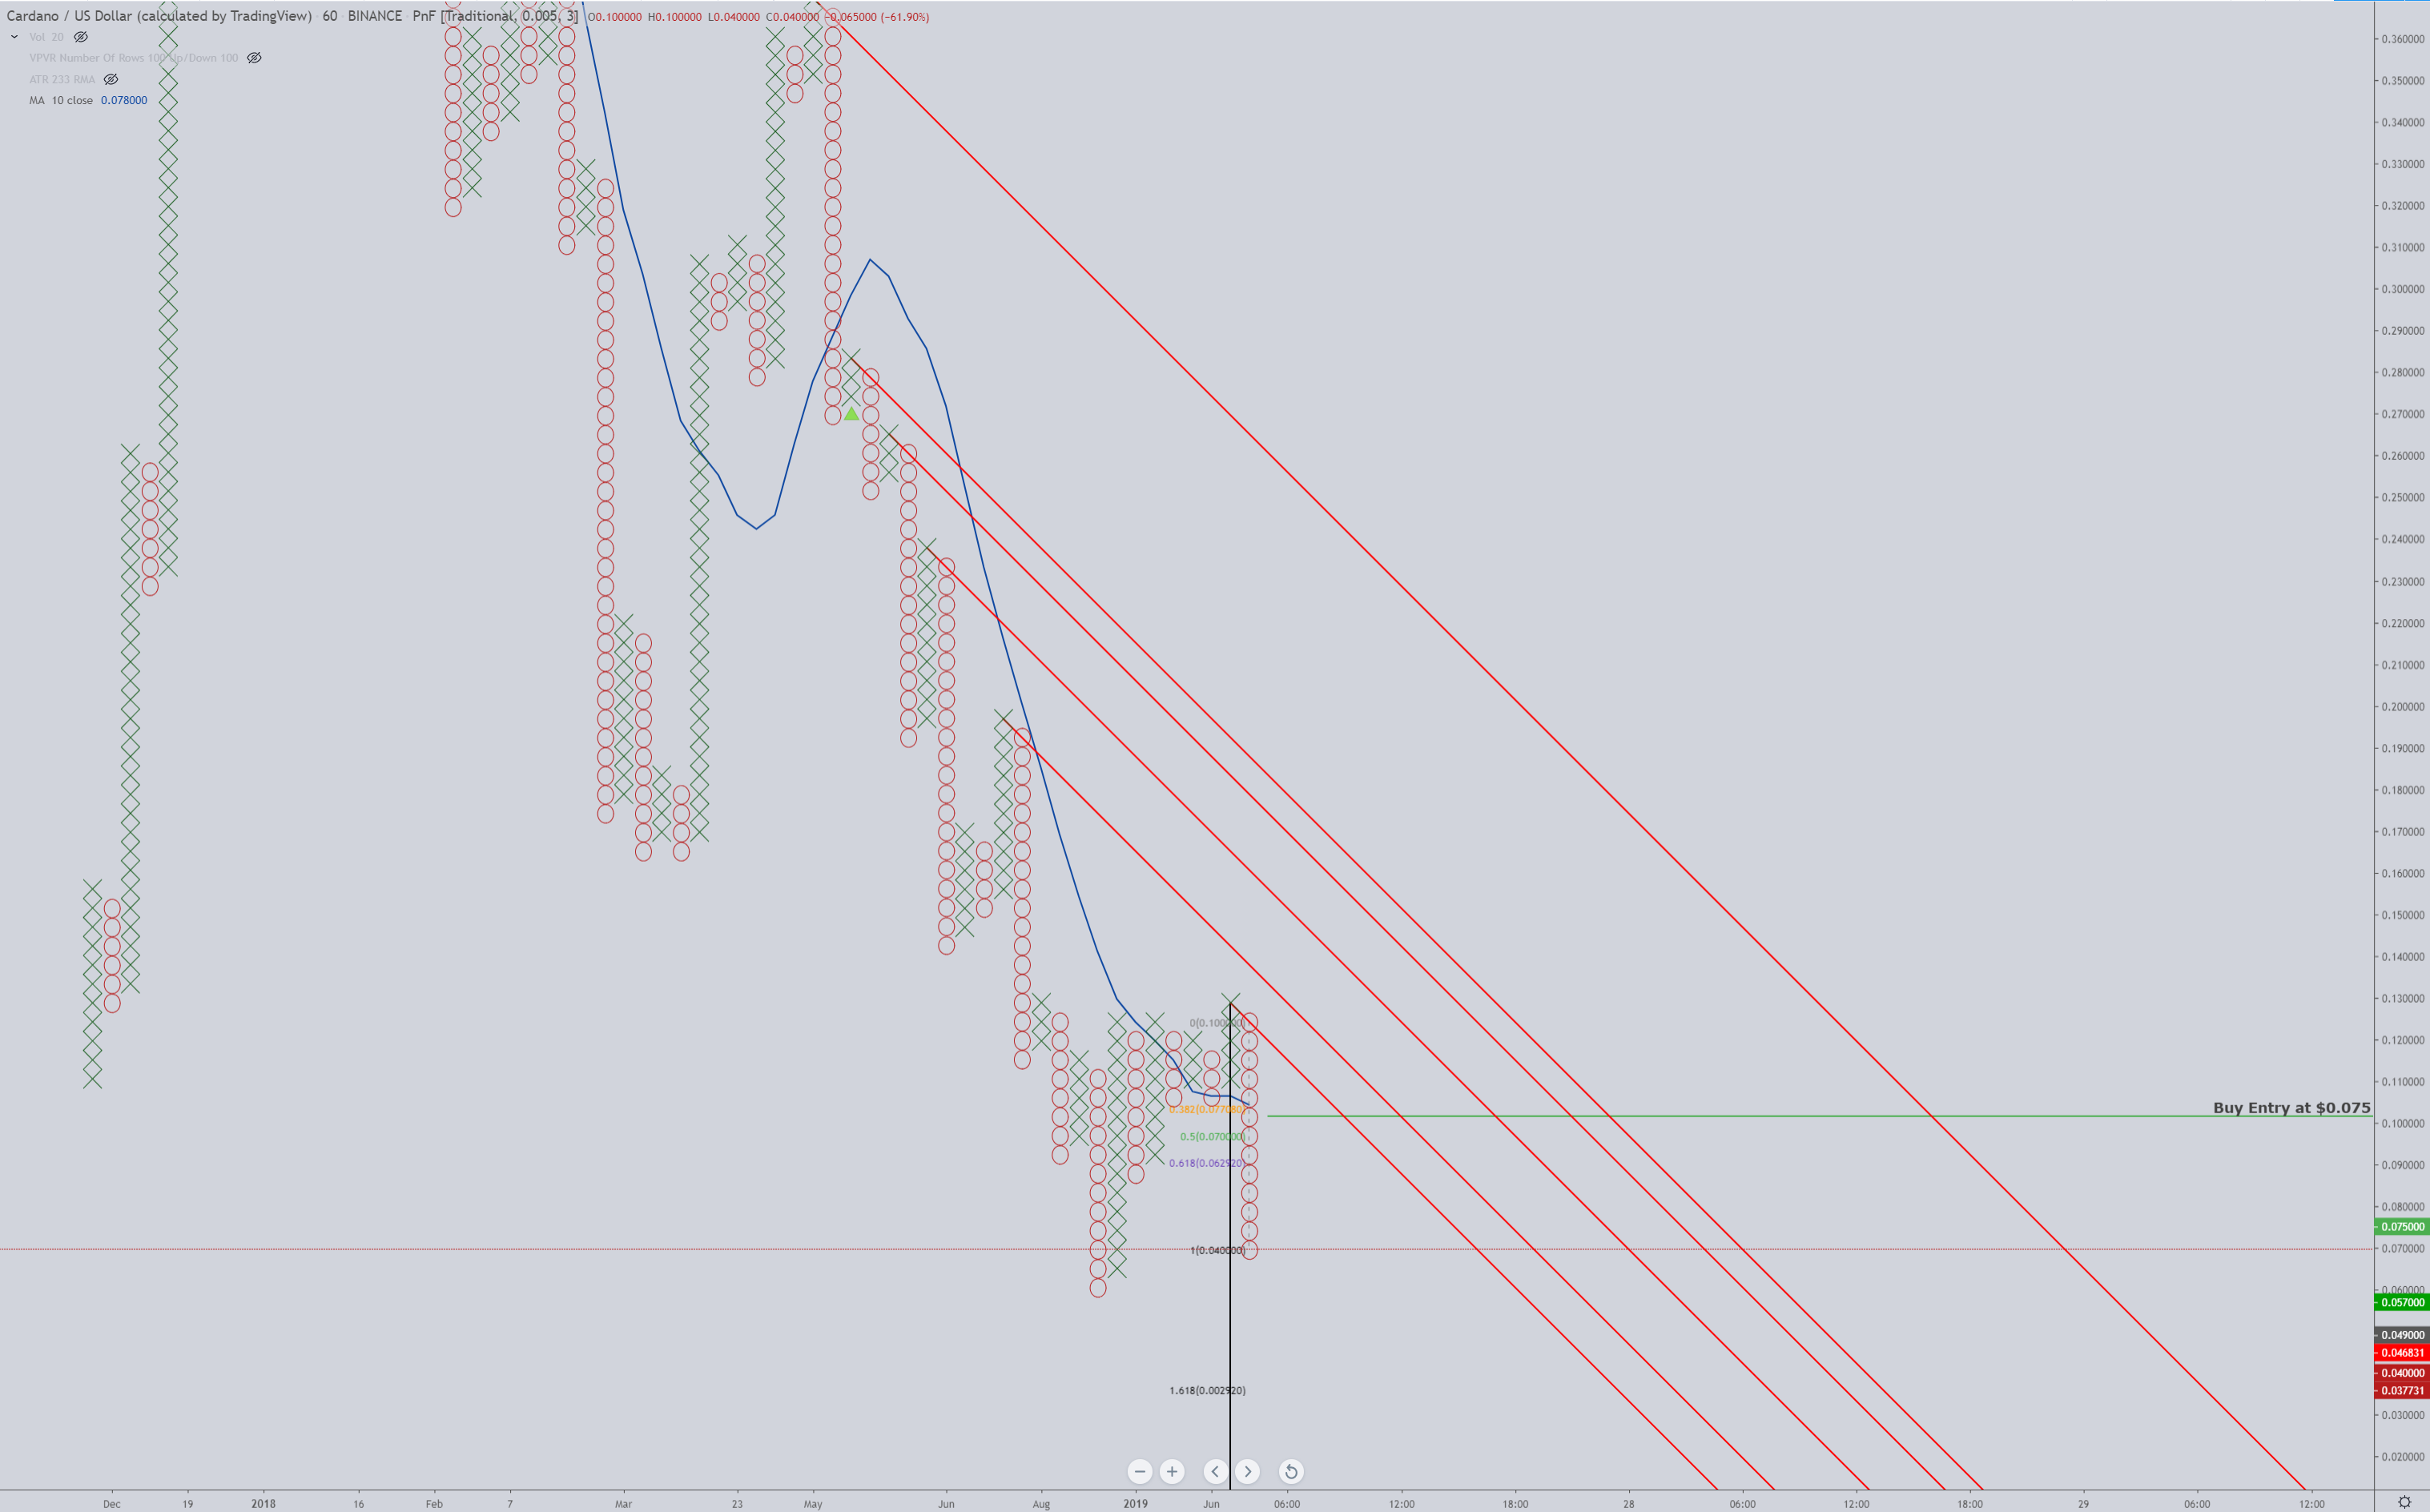
Cardano is also displaying a pole pattern on it’s Point & Figure chart. While Point and Figure does not record time, we can nonetheless identify the time and date that a new reversal column formed. This current column of Os has been in existence since June 27th, 2019 – nearly four months. That is quite a long time for a column to exist without a reversal, especially with a relatively small box size (0.05). The rules for entry here would be the same as the trade idea for Ethereum: price moving above the 50% range of the current column. The buy entry conditions will be met when price moves up to $0.075.
Chainlink (LINK/USD)

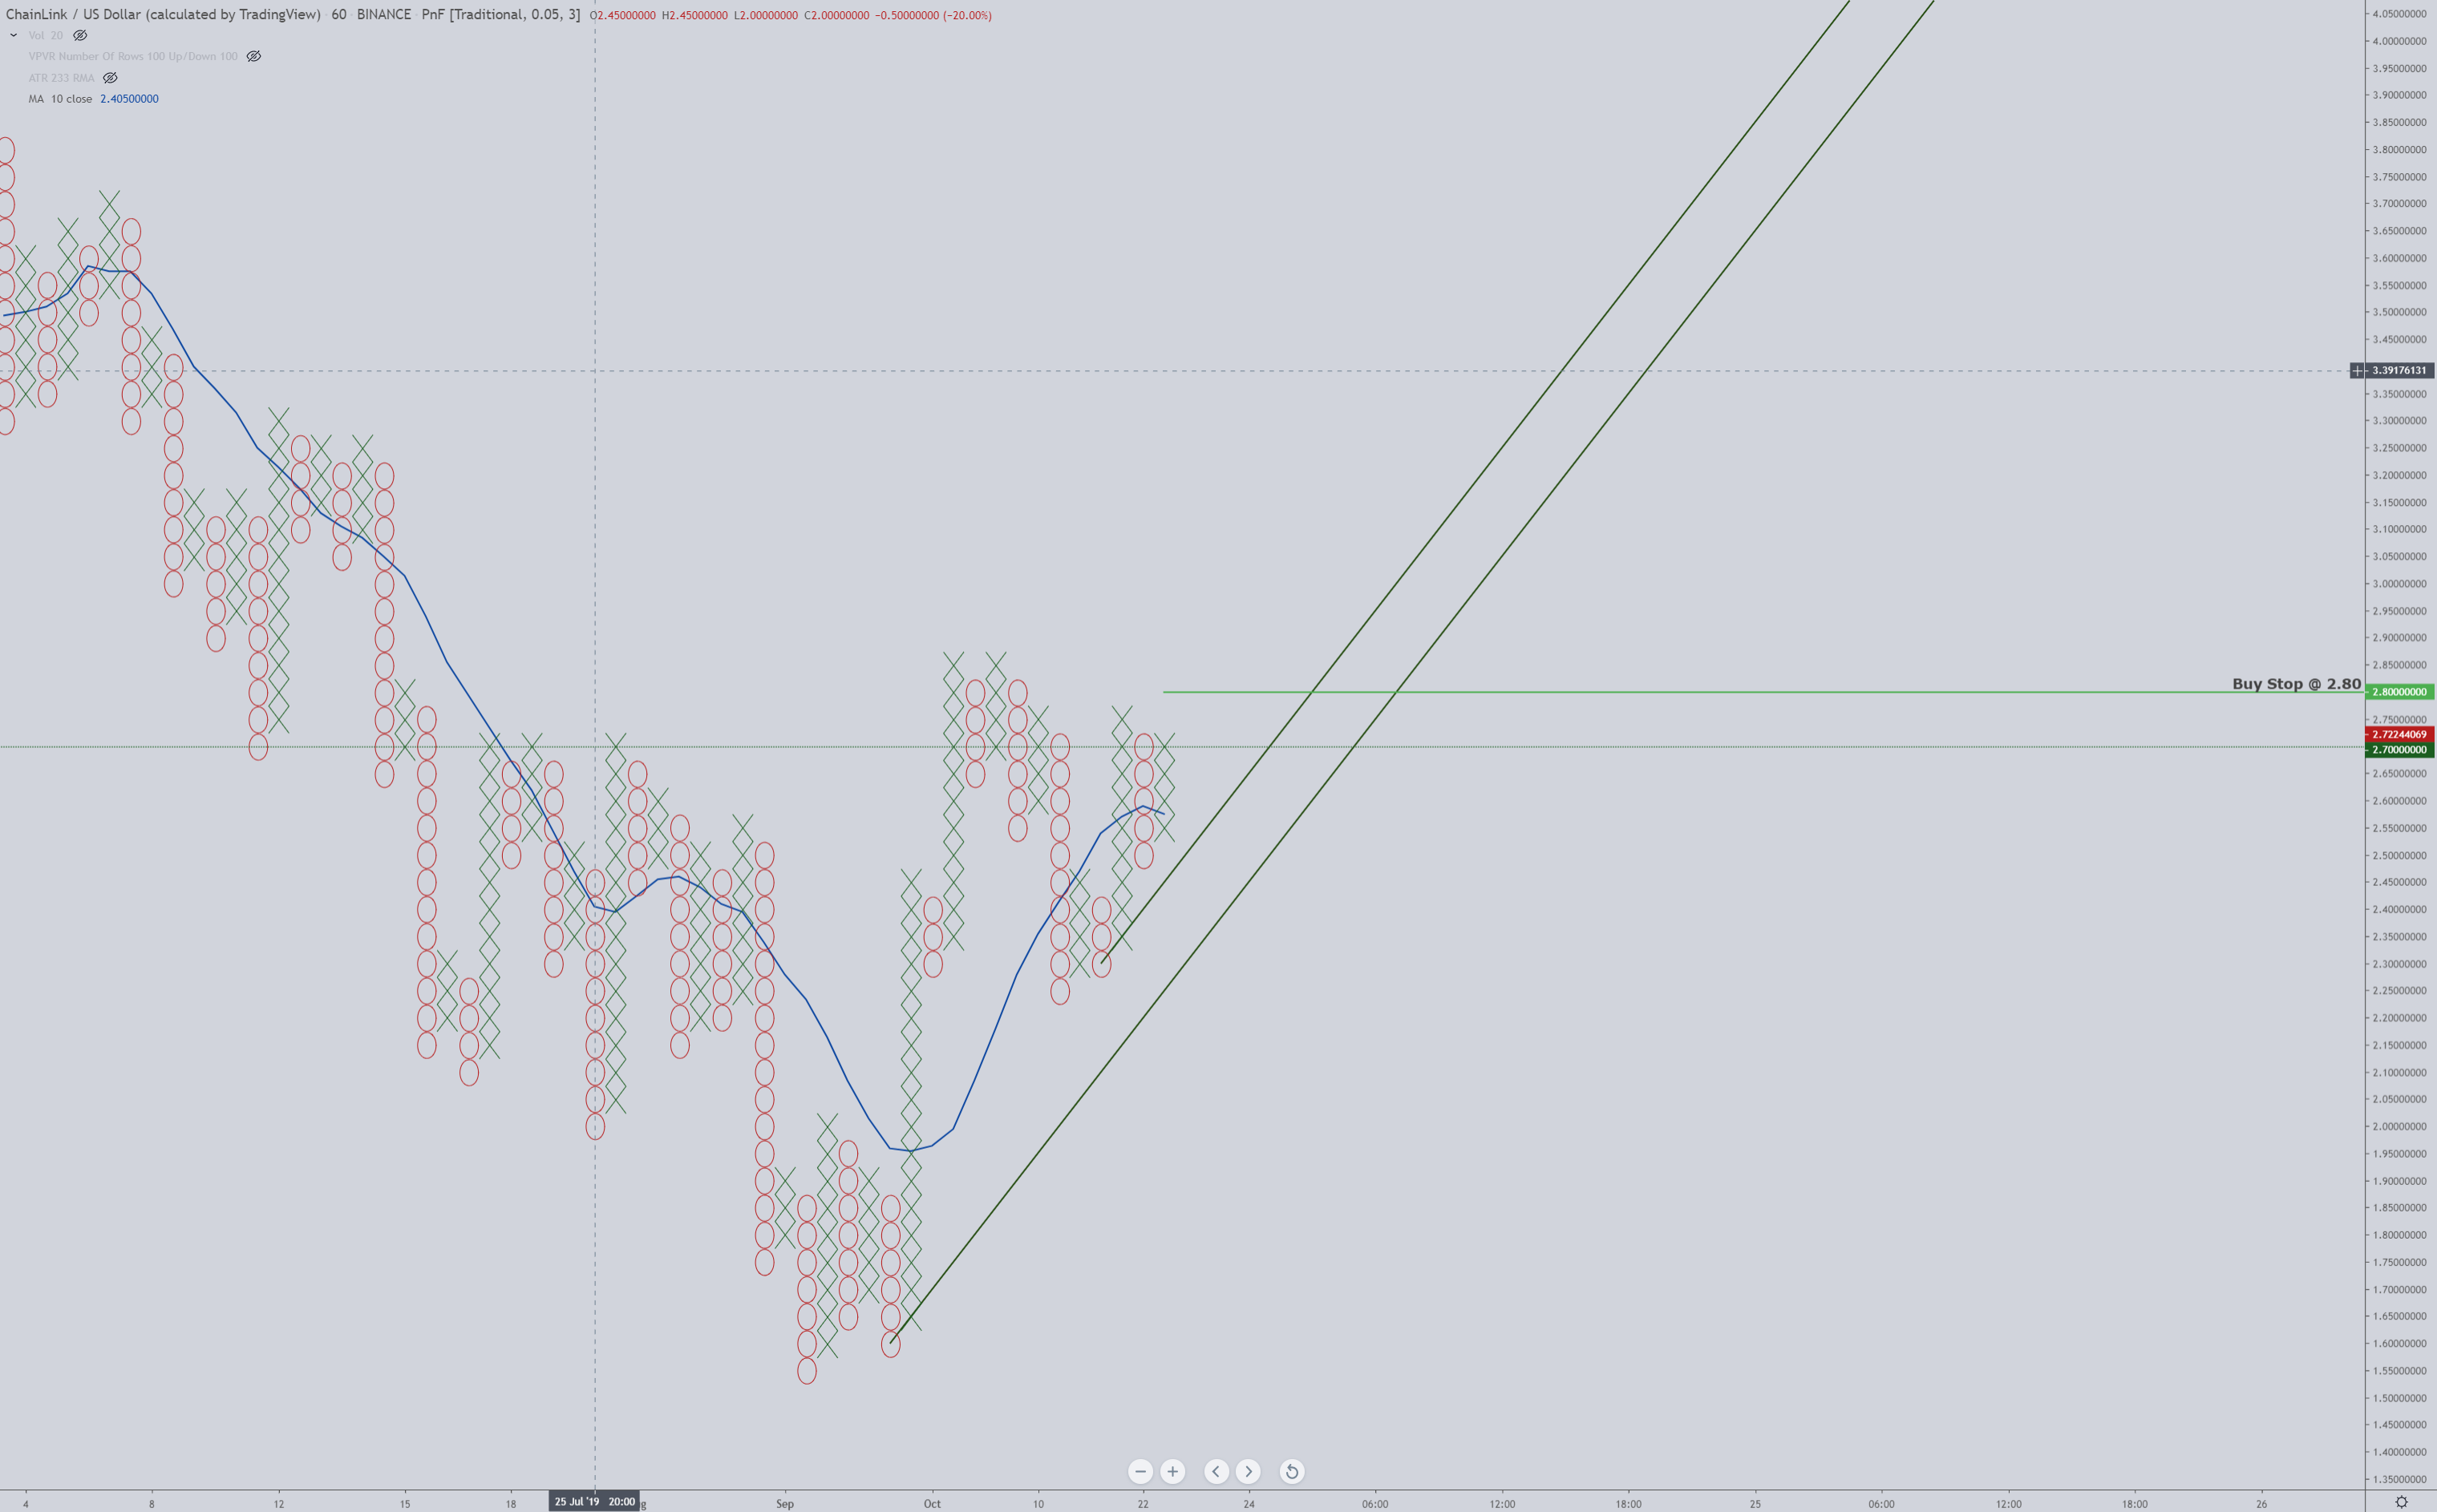
Chainlink (LINK) is one of the few cryptocurrency and altcoins that is trading in a bull market. It has experienced some recent pullbacks, but it has continued to rally throughout 2019 and has been outperforming even Bitcoin at various points of the year. Litecoin currently has a double top at $2.75, and I put a buy stop @ $2.80. Now, there is a part of me that wants to wait because of the $2.85 price level where there is a prior double top. One could consider a return to $2.85 as a split triple top. Because of the bullish trend that exists, I am opting for entry at $2.80 because both of the double tops are above the current MA.
Stellar (XLM/USD)

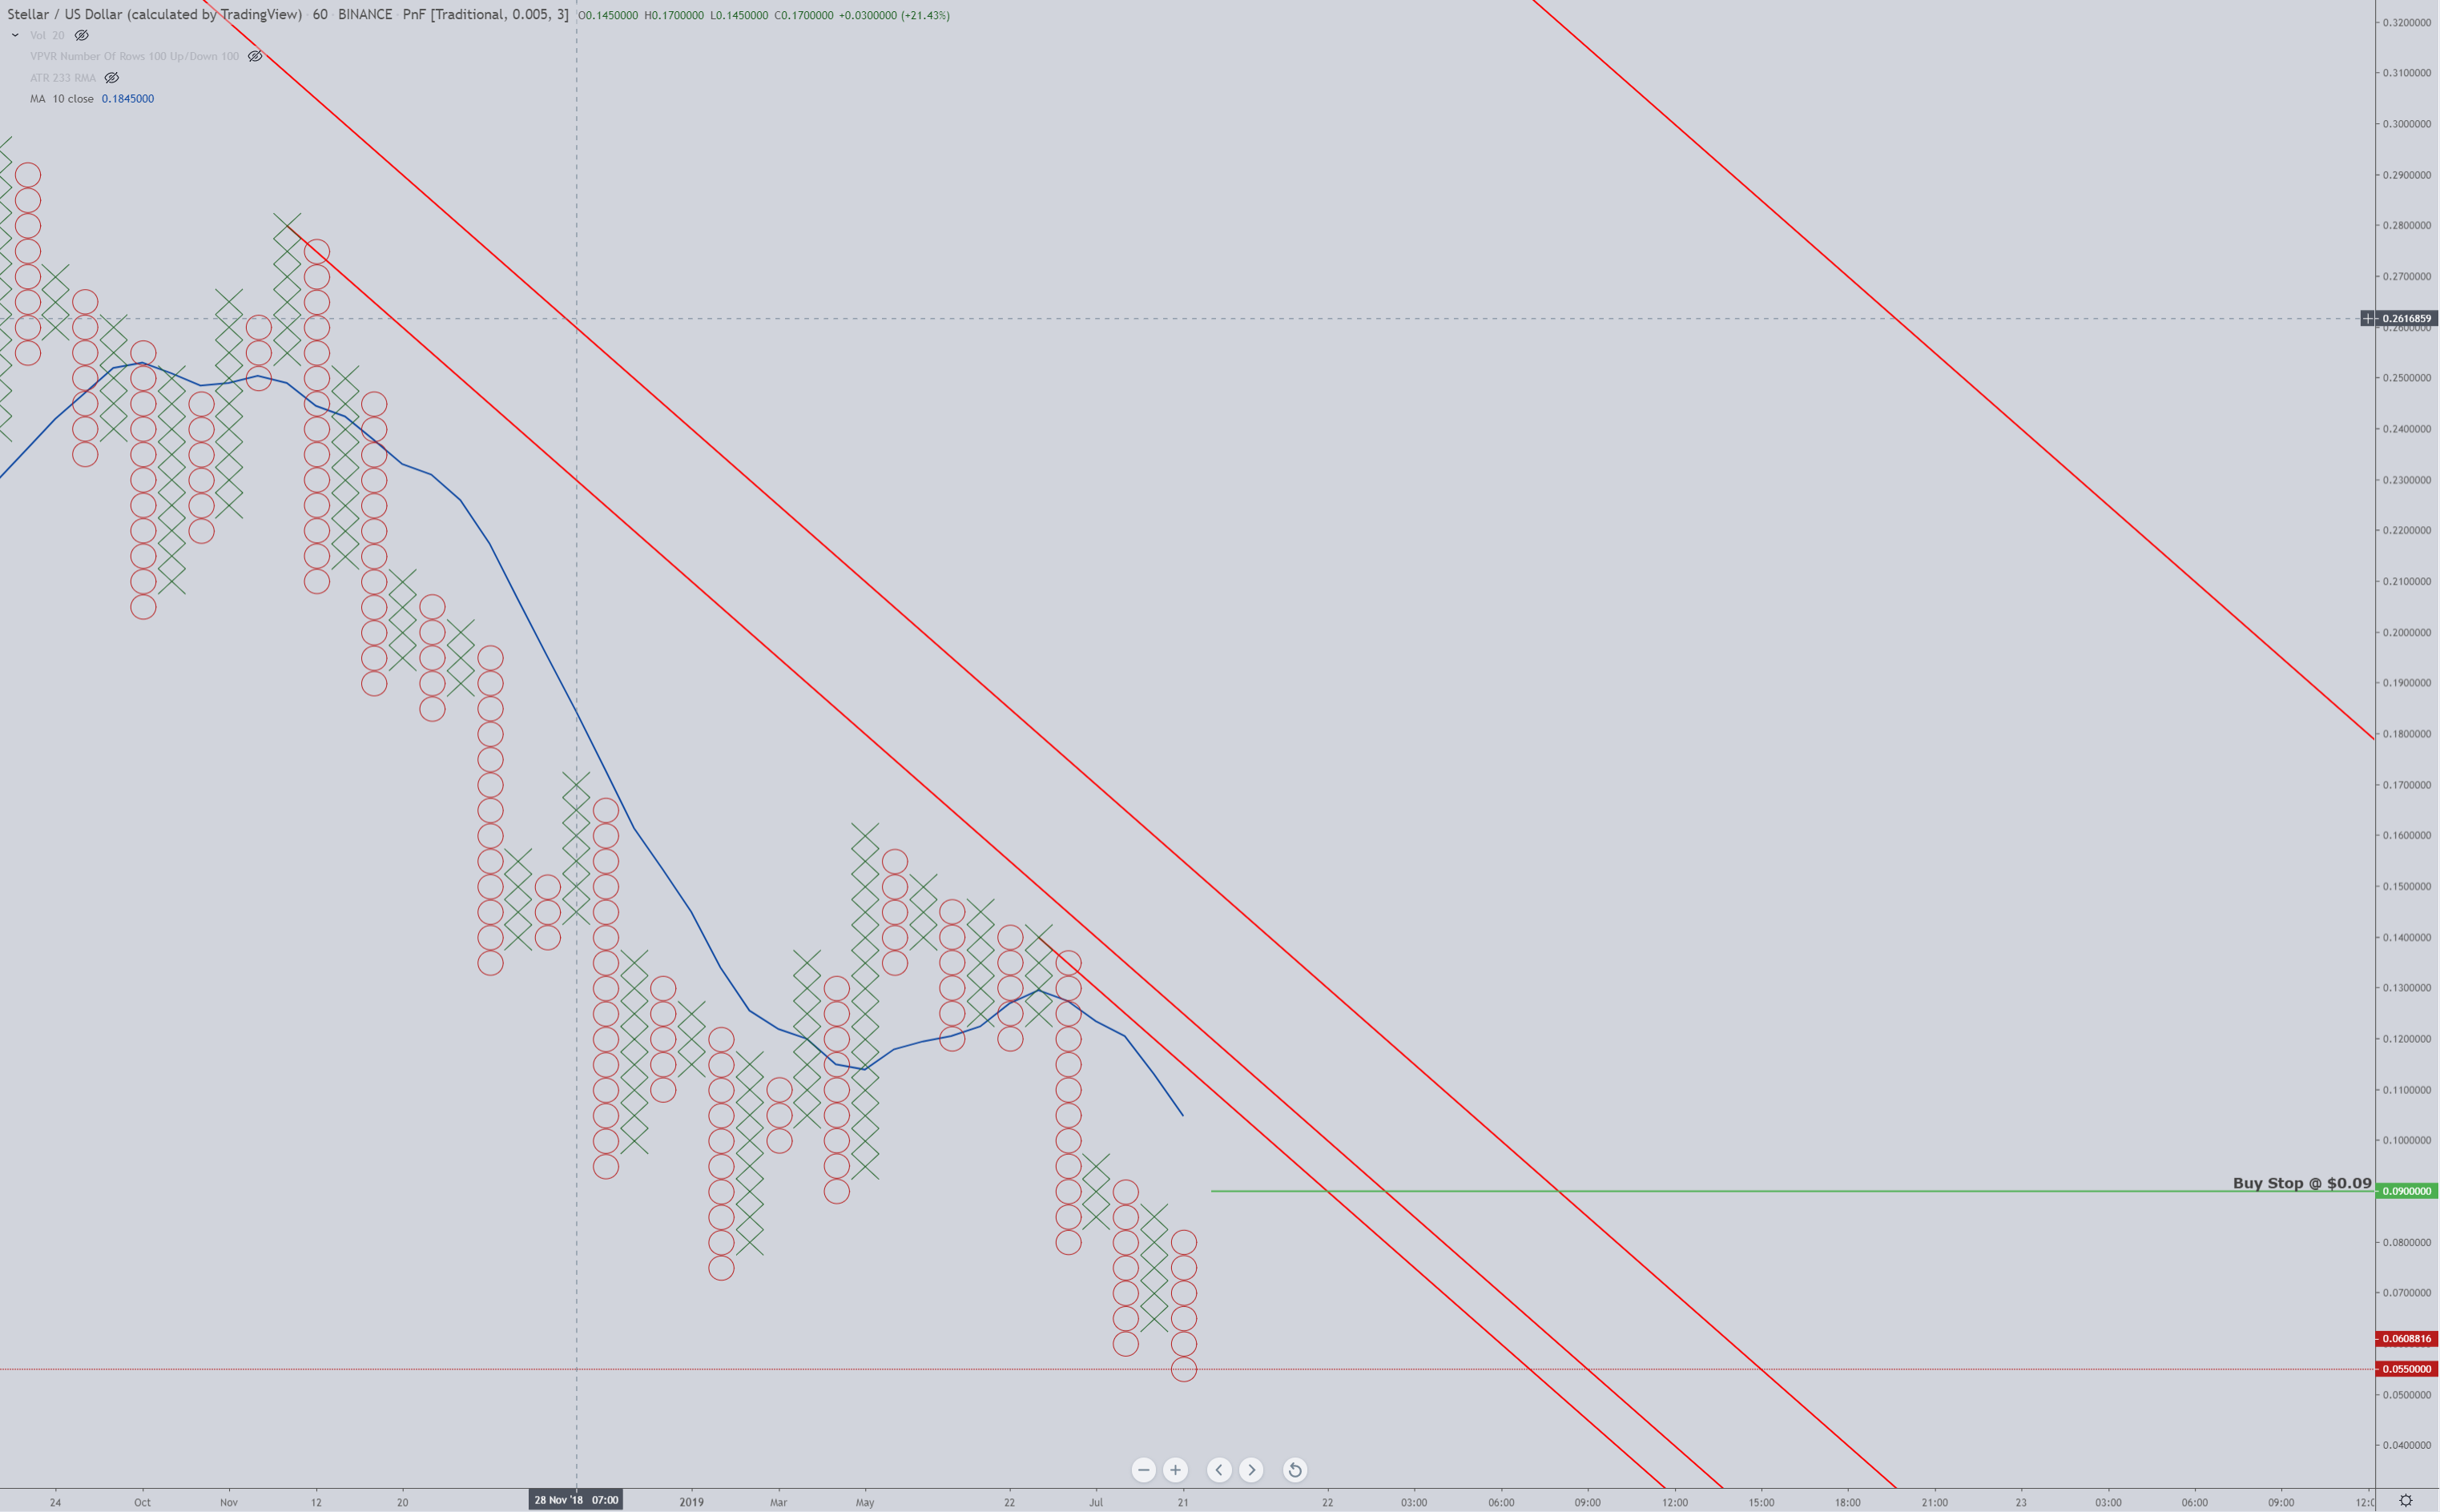
Stellar has been one of the single most bearish and underperforming cryptocurrencies since the bear market started in December of 2017. It has done little but produce consistent and constant new lower lows for the entirety of 2019. That said, there has been some significant consolidation and volume pour in at these historically low price levels – a condition that is found across many important altcoins. I mentioned pole and spike patterns as examples of reasons why I would ignore my standard entry conditions – there is one more: traps. Bear traps and bull traps are constant in every market and on any chart style. They are unavoidable. Significant research has shown that any attempt to identify traps and avoid them often causes more losses and missed gains than reasonable than productive risk management would accomplish. I have a buy stop for Stellar (XLM) at $0.09, which would be the confirmation of a bear trap. The current column of Os shows a short entry that was generated when price dropped below the double bottom at 0.06. If price were to create a new X column and then reach my entry target, then a confirmed bear trap will have been established. The reason for taking a long entry on this bear trap is due to the proximity of price to the current objective downtrend angles as well as the proximity to the current moving average. If we get a confirmed bear trap, it is entirely likely that the short covering will provide sufficient momentum to see price move above the cluster of downtrend angles to create a new bull market.