- A correction and a meager bounce
- Oil products signal rising demand
- Inventories in Q1 were mostly bullish
- Levels to watch in crude oil
- The three most bullish factors for the energy commodity in Q2
- The market is heading into the peak driving season as vaccines create herd immunity to COVID-19. Gasoline demand will be far higher in 2020 than in 2021. Moreover, people will begin traveling again, boosting air travel and distillate fuel demand.
- OPEC+ continues to maintain its level of supply quotas. The Saudis, Russians, and other cartel members would rather sell fewer barrels at a higher price than more at a lower one. After suffering because of rising shale output over the past years, OPEC+ now has more pricing power and the ability to squeeze higher prices from US consumers. US output has dropped by 100,000 barrels per day from the start of this year despite rising demand.
- As the Biden administration addressed climate change, it will tighten the regulatory environment for extracting fossil fuels from the earth’s crust. On his first day in office, President Biden canceled the Keystone pipeline project that carries petroleum from the oil sands in Alberta, Canada, to Steele City, Nebraska, and beyond to Cushing, Oklahoma, the delivery point for NYMEX crude oil. The symbolic move signified the administration’s shift to support alternative energy sources and inhibit US production. US output will decline when demand is rising as the pandemic fades into the market’s rearview mirror.
Crude oil prices moved higher throughout most of 2021’s first quarter. Brent crude oil rose 20.67%, and the United States Brent Oil Fund (NYSE:BNO) moved from $12.88 to $15.88, a 23.3% gain. NYMEX WTI crude oil futures gained 21.93%, with the United States Oil Fund (NYSE:USO) rising from $33.01 to $40.53 per share or 22.8%. The backwardation or nearby premium in the oil futures markets caused the ETF products to outperform the continuous futures contracts’ moves.
At the end of last week, WTI crude oil was sitting below the $60 level, with Brent futures around $63 per barrel. NYMEX and Brent futures are consolidating and digesting the recent selloff as we head into the second quarter, which marks the start of the US driving season.
At this time last year, WTI futures were on their way below zero. On April 20, they fell to a low of negative $40.32. Brent found a low at $16, the lowest level of this century. What a difference a year can make. The bear in April 2020 transformed into more of a bull in April 2021.
A correction and a meager bounce
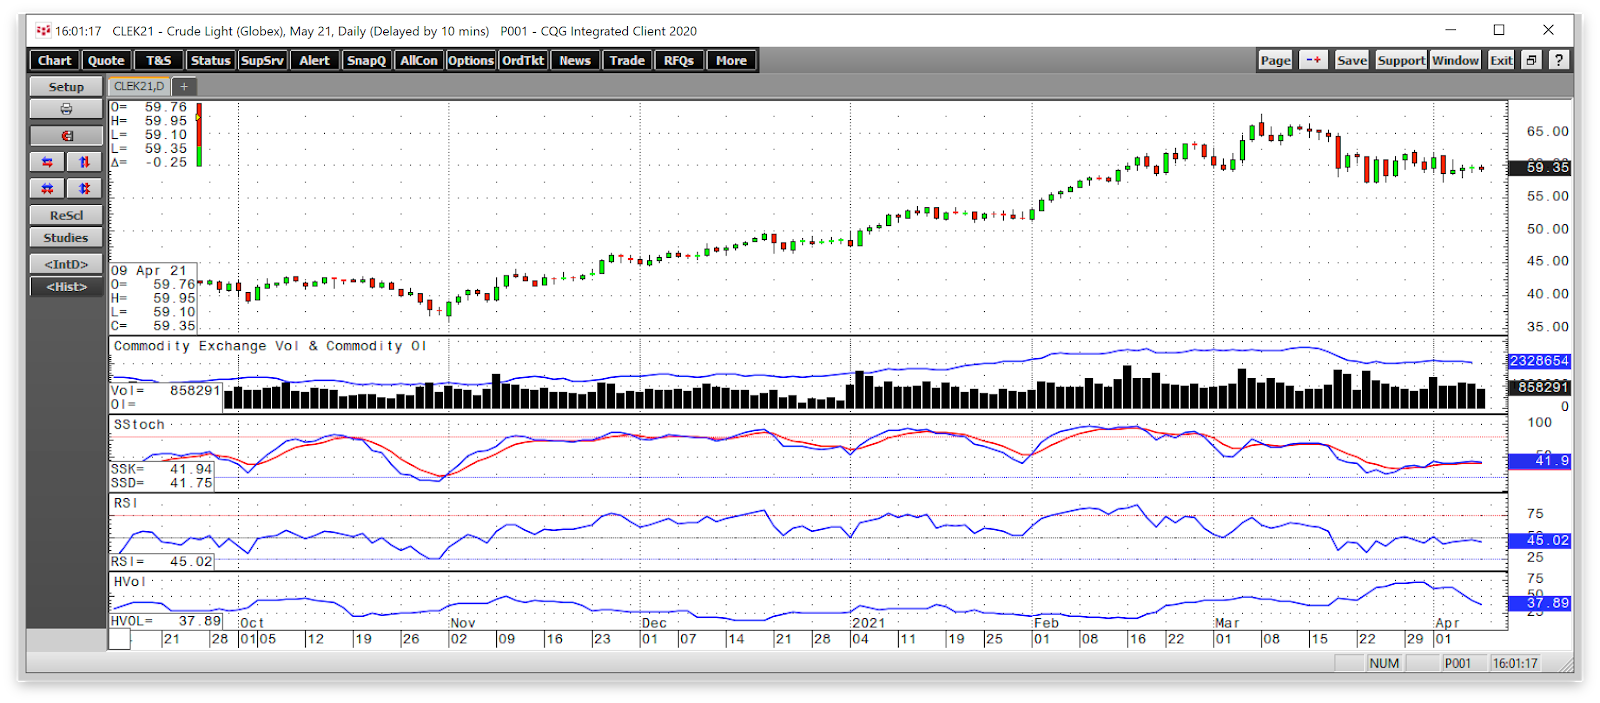
NYMEX crude oil futures reached the most recent high on March 8 when the price of May futures reached $67.79 per barrel.
Source: CQG
As the daily chart highlights, May NYMEX crude oil futures fell to a low of $57.25 on March 23 and have traded in a range from $57.29 to $62.27 since March 24 as of Friday, April 9. It closed last week at the $59.32 level. Open interest, the total number of open long and short positions in the NYMEX futures market, dropped from 2.54 million contracts in mid-March to 2.33 million at the end of last week. The move lower caused some of the trend-following longs to exit risk positions. Falling open interest when the price of a futures contract corrects is not a technical validation of an emerging bearish trend.
Price momentum and relative strength indicators were sitting below neutral readings. Daily historical volatility reached a peak at over 70% in late March but declined to the 37.90% level on April 9. The price variance measure tends to move higher during corrections as crude oil takes the stairs higher and elevator to the downside.
Oil products signal rising demand
The price action in oil products supports crude oil as we head into the peak driving season in the US. Moreover, as vaccines create herd immunity to COVID-19, higher demand for gasoline and distillate requires more crude oil, the primary input in the fuels.
Source: CQG
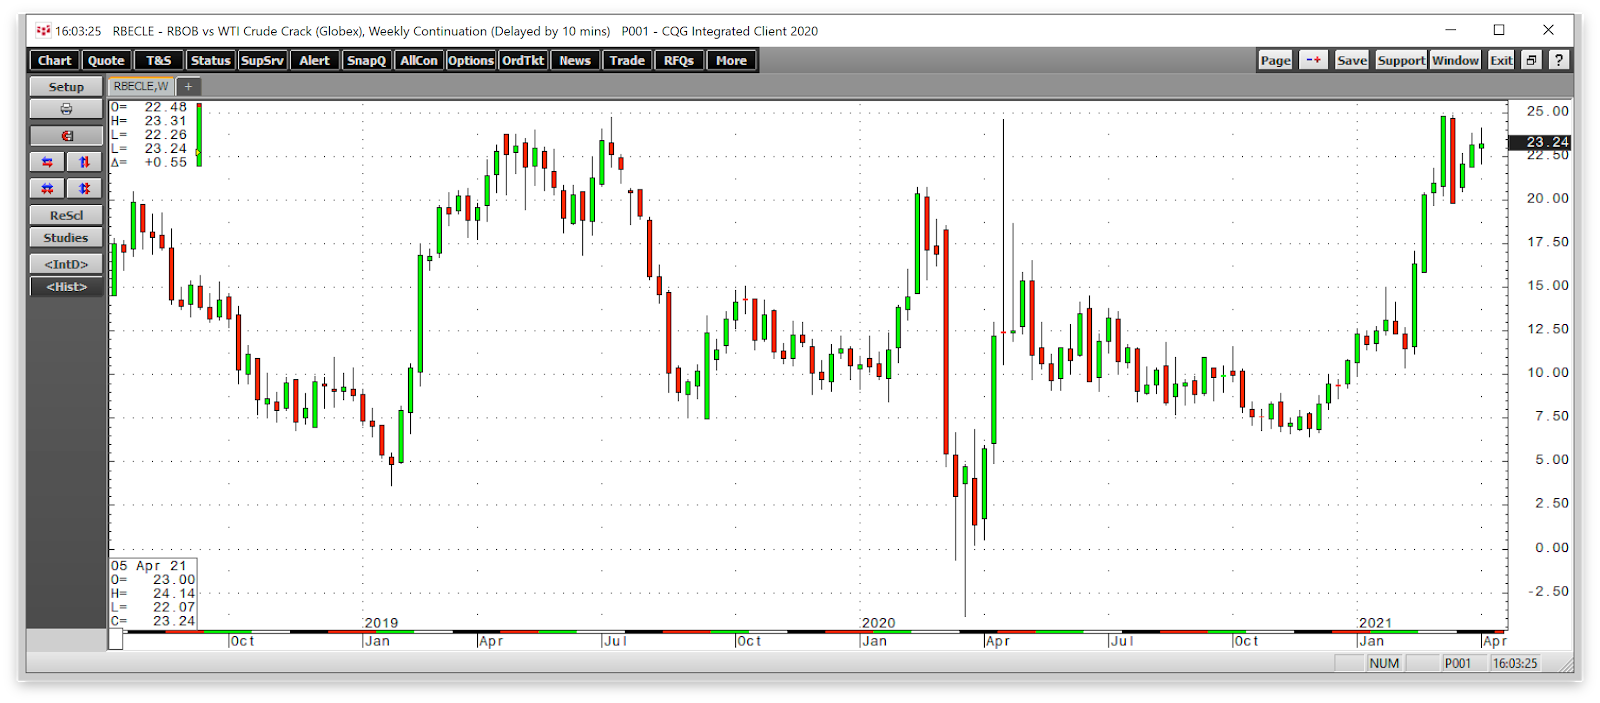
The weekly chart of the gasoline crack spread illustrates the steady rise to the $23.24 per barrel level in the refining margin. Increasing demand for gasoline puts upward pressure on the spread that reached a high of $24.86 in mid-March, the highest level since May 2018.
Source: CQG
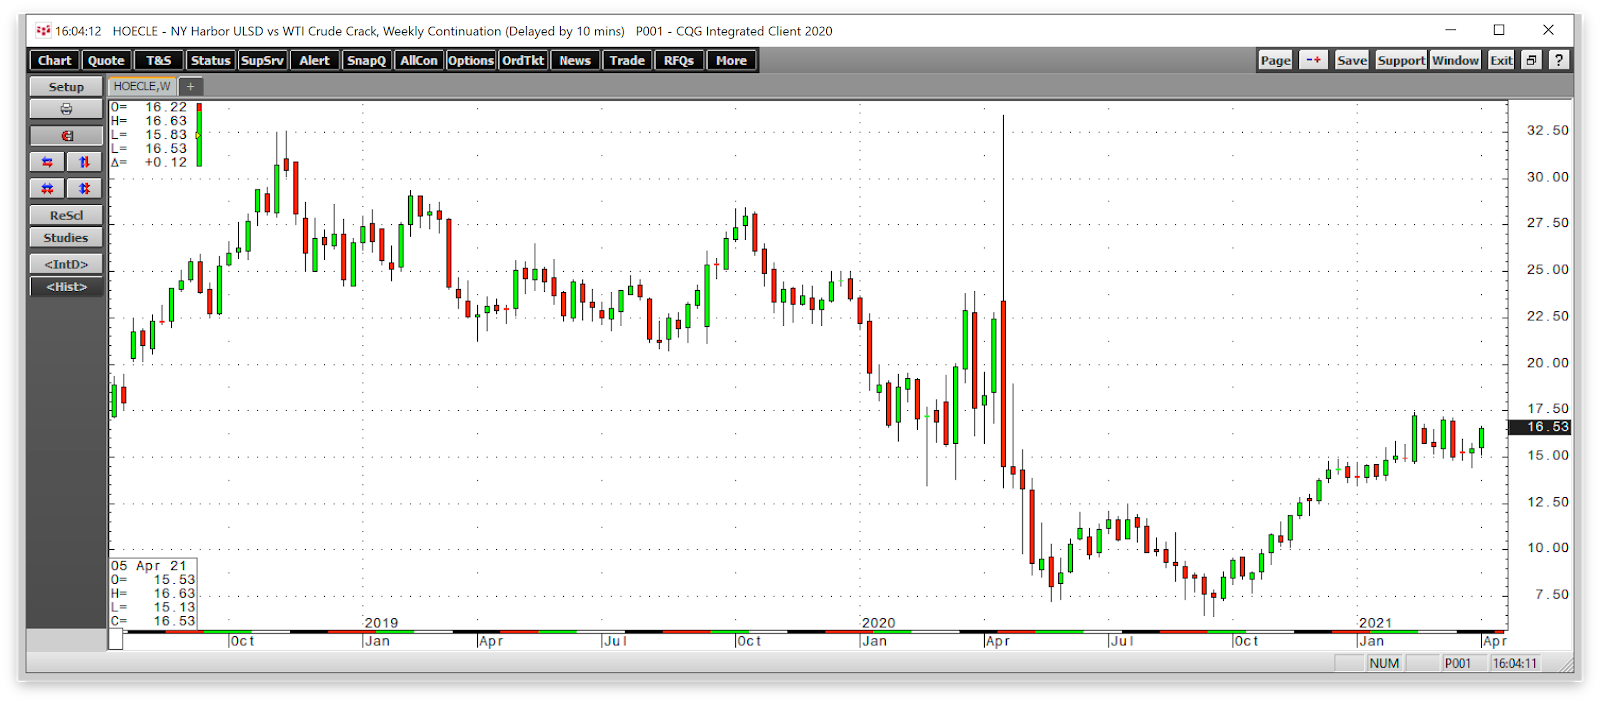
The heating oil crack spread is a proxy for other distillates, such as diesel and jet fuels. As the US economy makes a comeback, distillate demand has been rising. The trend in the distillate crack has been higher since mid-September. The spread hit a high of $17.40 in mid-February and was trading at $16.53 per barrel at the end of last week.
The crack spreads’ price action indicates rising demand for oil products at the beginning of 2021’s second quarter.
Inventories in Q1 were mostly bullish
Source: API
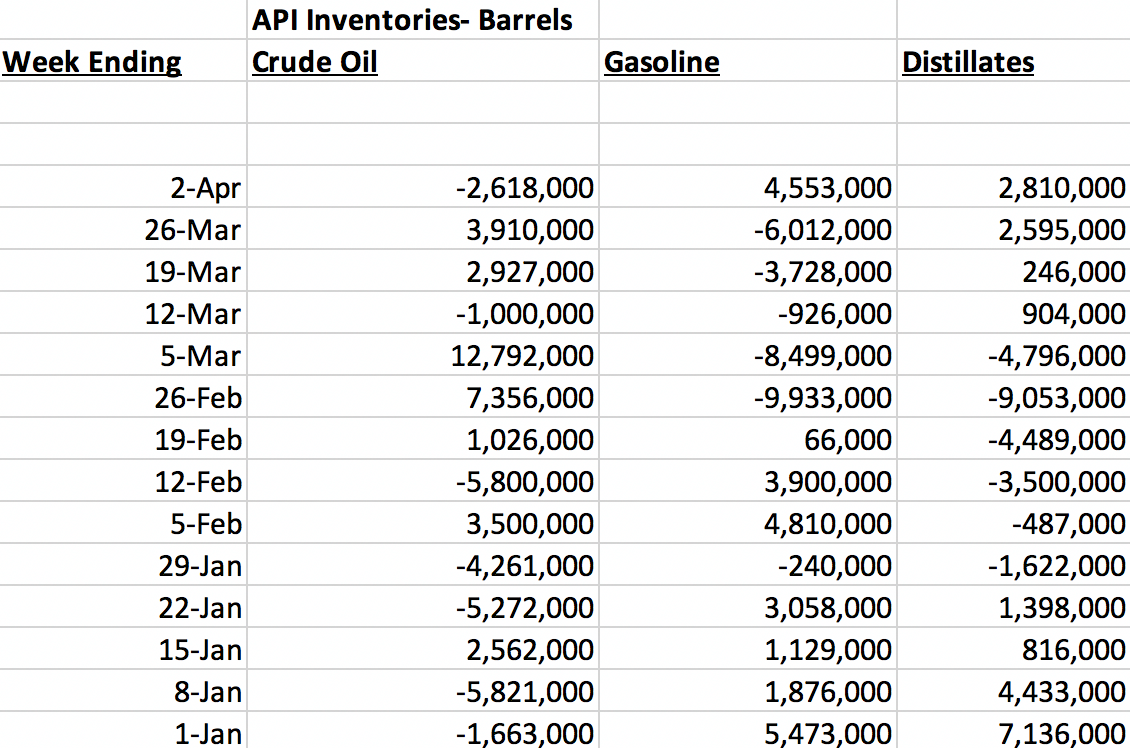
Since the start of 2021, inventory reports from the American Petroleum Institute and Energy Information Administration have been mostly bullish for the oil market.
The API’s weekly data shows an increase of 7.638 million barrels of crude oil since the start of this year. Meanwhile, gasoline and distillate stockpiles have declined by 4.473 million and 3.609 million barrels, respectively. The decline in product stocks was slightly larger than the increase in petroleum inventories, supporting the energy commodity.
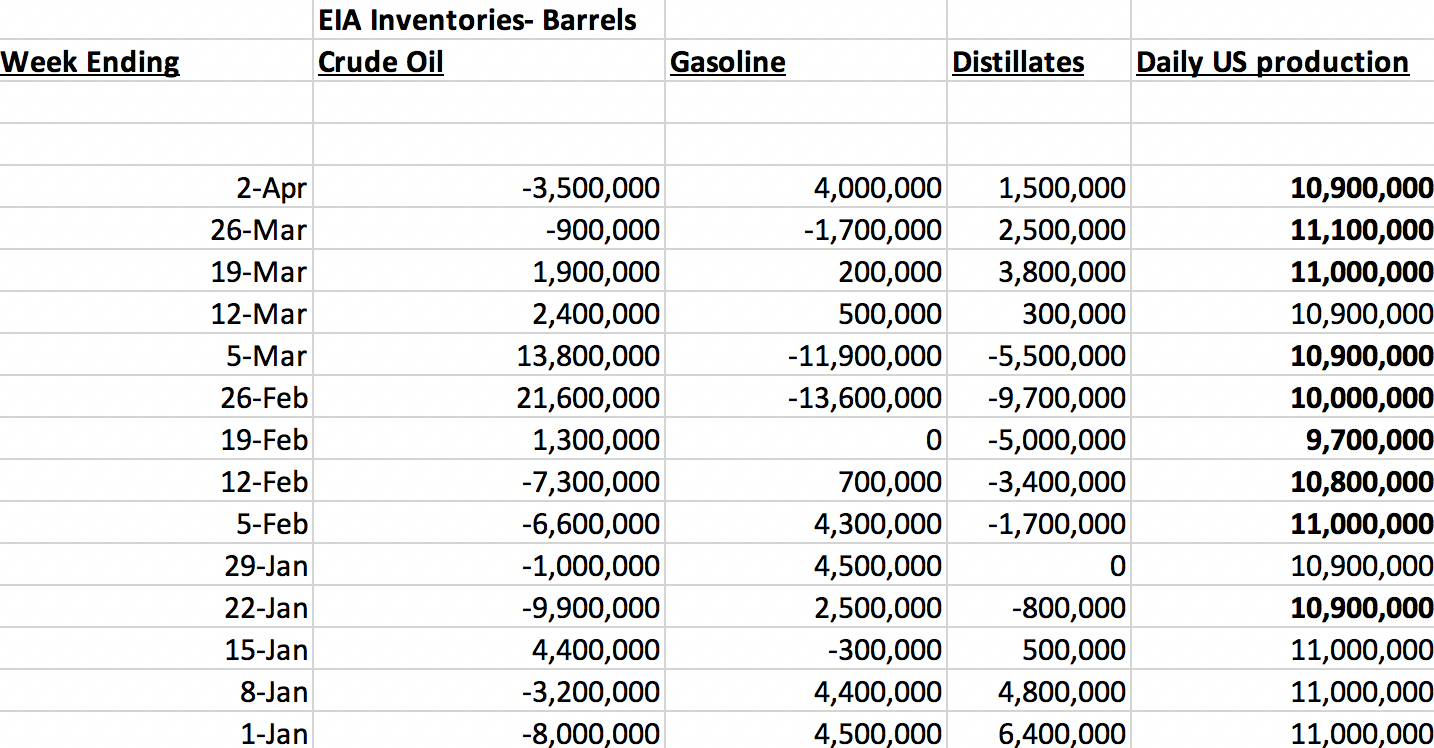
Source: EIA
The EIA’s weekly data highlights an increase of 5.0 million crude oil barrels since January 1, 2021. Gasoline and distillate inventories declined by 1.90 million and 6.30 million barrels, respectively. Both the API and EIA data show that declines in oil product supplies were higher than increases in petroleum stocks over the past three months.
Meanwhile, US daily crude oil output reached a record high of 13.1 million barrels per day in March 2020. The chart shows that at 10.9 mbpd, it was 100,000 lower than at the start of this year.
Levels to watch in crude oil
Source: CQG
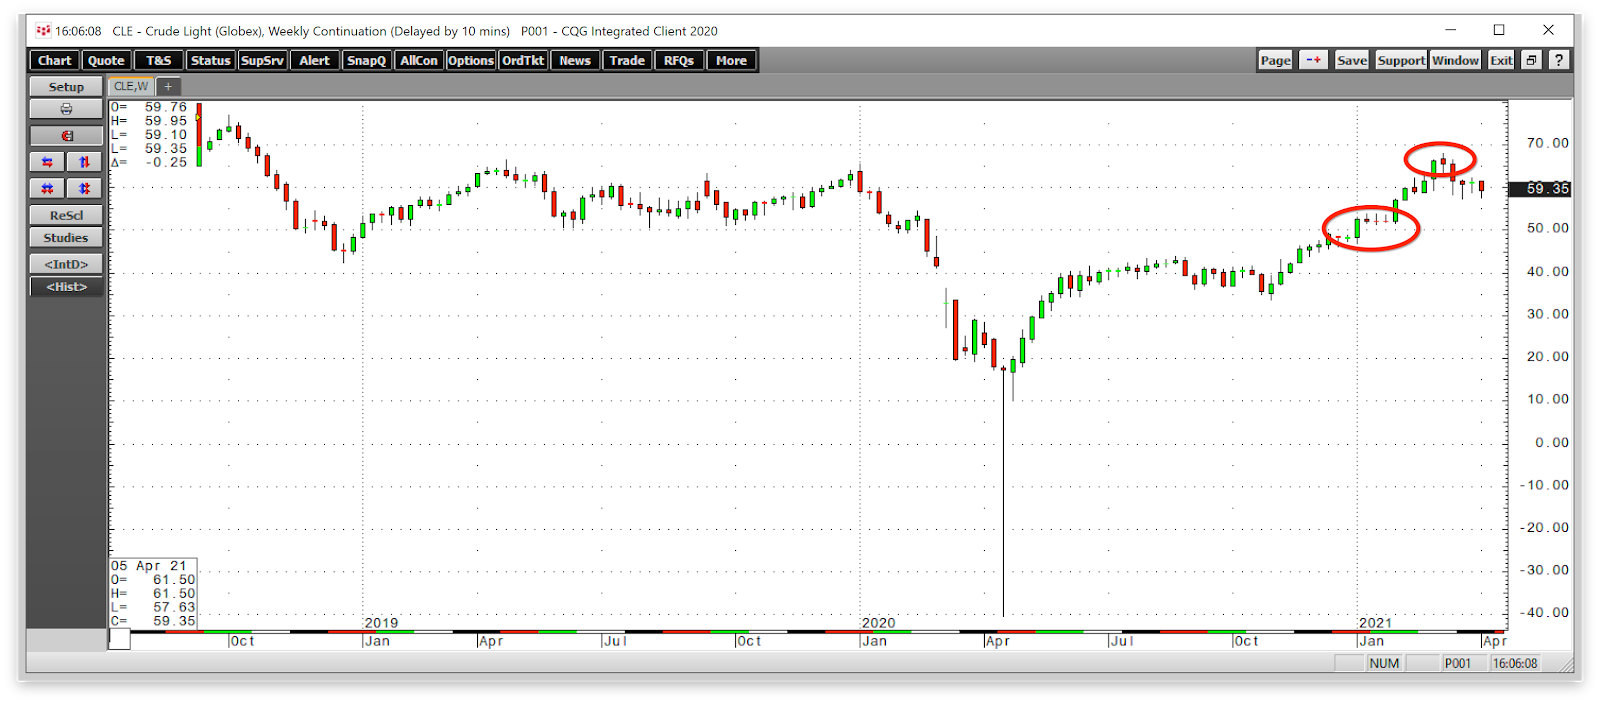
The NYMEX WTI crude oil correction took the price to just below the $60 per barrel level. Last April, the price was heading for a bearish abyss below zero.
The chart shows that technical support on the weekly chart stands at $51.44, the low from the week of January 19, 2021. Resistance is at the March $67.98 peak on the continuous contract. Brent crude oil reached a high of $71.36 in early March, 63 cents shy of its critical technical resistance level at the January 2020 $71.99 high. Support for Brent futures stands at $54.49 per barrel, the mid-January 2021 low.
The three most bullish factors for the energy commodity in Q2
After rallying by more than $108 on the WTI futures and $55 on Brent futures since last April, the correction has been mild. Three factors continue to support the oil price as we head into Q2:
NYMEX crude oil was sitting above the recent low at $57.25 at the end of last week. The prospects for the energy commodity remain bullish given the market’s supply and demand fundamentals as we head into Q2 2021 and the peak driving and travel season in the US.
