Get 40% Off
These stocks are up over 10% post earnings. Did you spot the buying opportunity? Our AI did.Read how

Crude Oil Ready for Another Rally

Published 06/29/2016, 09:58 AM
Updated 01/11/2024, 05:37 AM

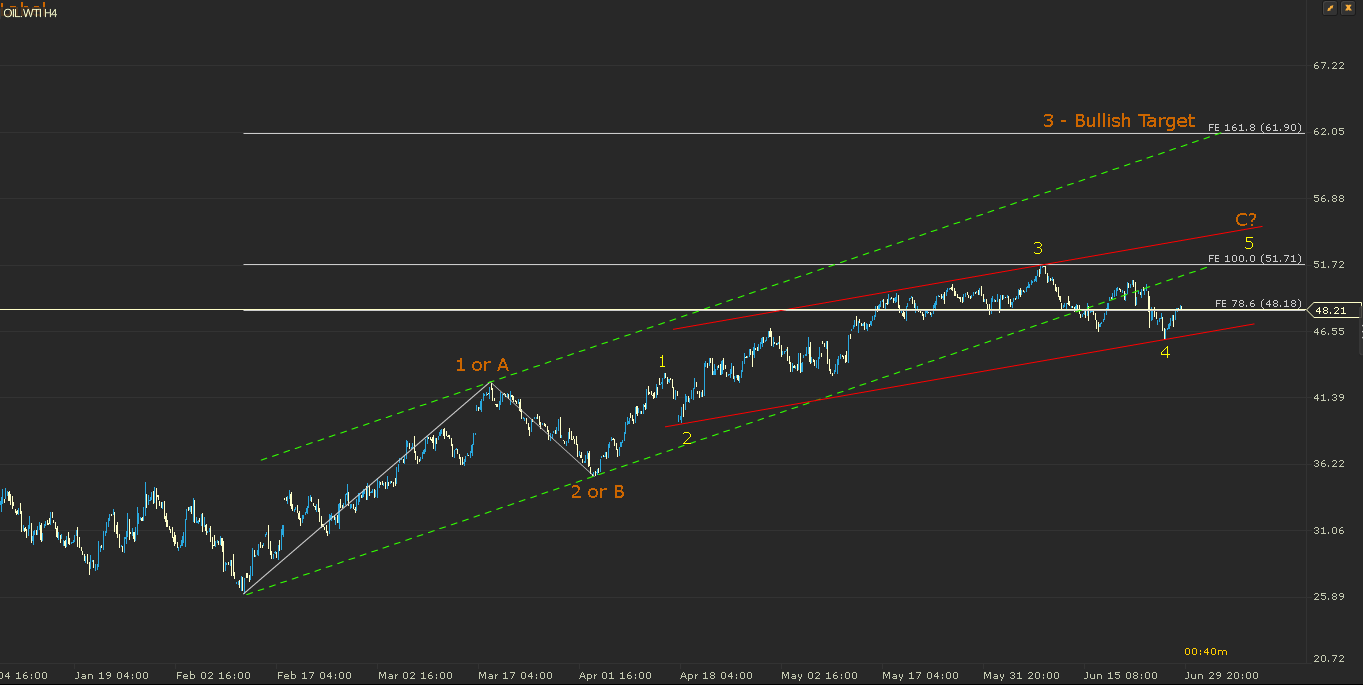
Crude Oil 4H Chart - Elliott Wave Count - June 29, 2016

WTI Crude Oil 4H Chart

Crude has continued the bullish channel and we predicted both the end of the yellow 3 and 4 wave accordingly. This bounce off the yellow 4 should hold $45.80 or the lower-bound of the red trendline in order for the 5th wave to continue and target $54-$56 initially.

If this is going to turn into an impulsive wave 3, it needs to target the 162% extension level ($60-$62) shown in the above chart and confirm this bullish rally. Price stagnating at the 100% extension area ($51.70) is not good for the bullish continuation.

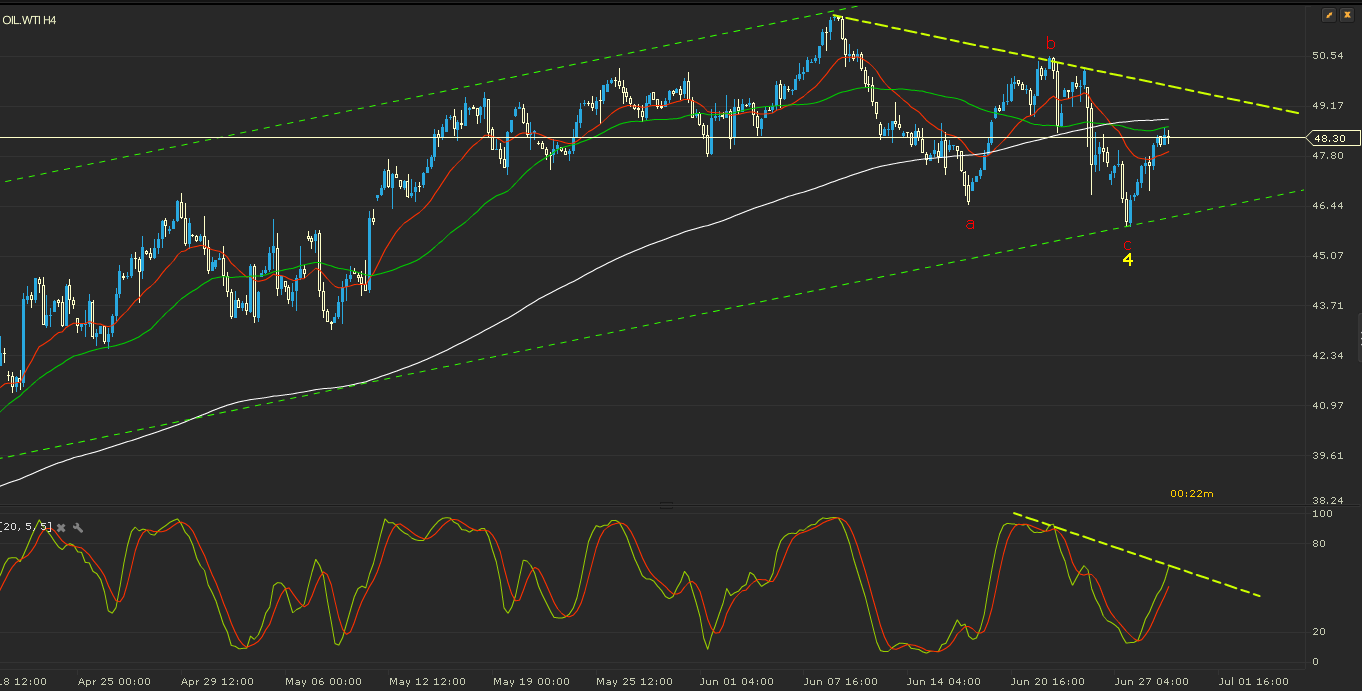
Crude 4H Chart - Technicals - June 29, 2016
WTI Crude Oil 4H Chart - 2


In this chart, we see that crude has some important resistance to take out if it is going to test $54 price level. In the 4H chart:

  • Crude is above 20EMA.- red line;
  • It is testing 50SMA - green line;
  • It has 200SMA at $48.80 - white line

Latest comments

This article and chart are too old....Manuplate people for take wrong decision..Don't believe on this article.
I agree with Mr.Favio. may go beyond 54. Correction from current price level will lead to shutdown of US rigs
I question the voodoo of your crystal ball of technical analysis here, for the following reasons:. . 1. US frackers are buying futures contracts like hotcakes with prices in the low 50s, effectively capping oil prices at that level. 2. December-April is the seasonal slack period in demand, in the US and world wide. 3. Oil inventories, by most reputable forecasters outlooks, will continue to grow until 2H 2017, best case (for the bulls). 4. Rising US rates over 2017 will add downward pressure to WTI. 5. US frackers and Canadian oil sands producers will significantly increase production with oil in the low 50s+, effectively offsetting any (dubious, at best) cuts by the latest OPEC-led "agreement" , increasing world supply and driving oil prices south. . Other than that, the outlook for oil prices in 2017 looks super, to me. Time will tell, happy new year, and invest rationally and wisely.
I just seen that...
They were buying futures awhile back when it hit 56.00.. If anyone is buying futures it's speculators. CHK's CEO mentioned 3.00 gas and 60.00 Oil for 2018 as a means to be profitable . They easily have the Gas and then some. I agree 54.00 will be hard to bust,but 48.00 has already been shown to be nice support 3 times already. What I have been keyed in on is the Cushing and that has been consistently going down for 2 months now.. Floating storage was bought up awhile back at bargain prices and sold on the recent pops over 50.00. It costs money to hold that .. So that tells me floating storage is all but gone. They have been drawing on Cushing because of lower importing . The oversupply is being drawn on. .............Now lets talk about Charts. The reason people bring them up is because so many use them and they are a reliable way to predict where prices may go. I would not discount Charts so easily.
Risk Disclosure: Trading in financial instruments and/or cryptocurrencies involves high risks including the risk of losing some, or all, of your investment amount, and may not be suitable for all investors. Prices of cryptocurrencies are extremely volatile and may be affected by external factors such as financial, regulatory or political events. Trading on margin increases the financial risks.
Before deciding to trade in financial instrument or cryptocurrencies you should be fully informed of the risks and costs associated with trading the financial markets, carefully consider your investment objectives, level of experience, and risk appetite, and seek professional advice where needed.
Fusion Media would like to remind you that the data contained in this website is not necessarily real-time nor accurate. The data and prices on the website are not necessarily provided by any market or exchange, but may be provided by market makers, and so prices may not be accurate and may differ from the actual price at any given market, meaning prices are indicative and not appropriate for trading purposes. Fusion Media and any provider of the data contained in this website will not accept liability for any loss or damage as a result of your trading, or your reliance on the information contained within this website.
It is prohibited to use, store, reproduce, display, modify, transmit or distribute the data contained in this website without the explicit prior written permission of Fusion Media and/or the data provider. All intellectual property rights are reserved by the providers and/or the exchange providing the data contained in this website.
Fusion Media may be compensated by the advertisers that appear on the website, based on your interaction with the advertisements or advertisers.
© 2007-2024 - Fusion Media Limited. All Rights Reserved.