
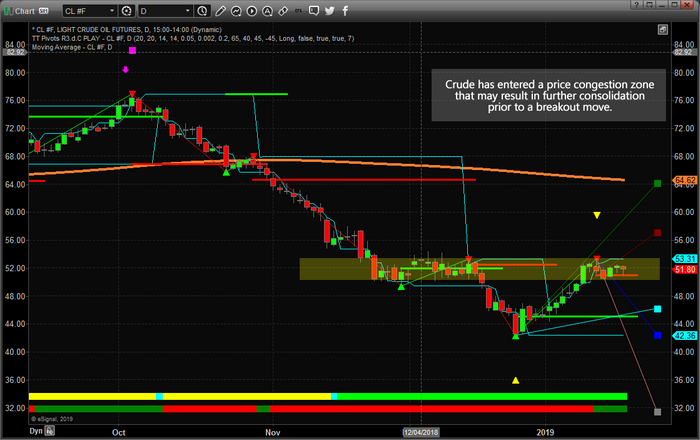
Our Adaptive Fibonacci modeling system is suggesting Crude Oil may have already reached very strong resistance levels just above $50 ppb. It is our opinion that a failed rally above $55 ppb will result in another downward price move where prices could retest the $42 low – or lower.
You can see from this Daily Crude oil chart that price has formed a consolidated price channel between $50 and $53 ppb. This price channel aligns with a November 2018 price consolidation zone. It is our belief that any advance above $55~56 ppb, will result in a new upward price move to $64-65 ppb.
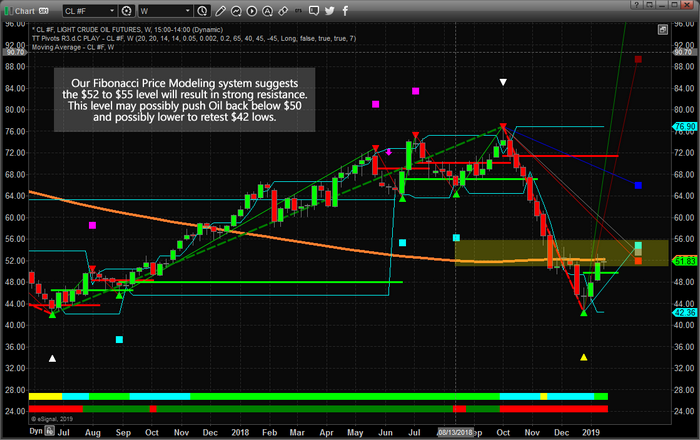
This Weekly crude oil chart highlights the Fibonacci projected price zones that represent the incredibly strong resistance level currently setup in Crude. The Weekly chart shows a zone between $50~56 as a critical resistance zone. One key element of Fibonacci price theory is that price must always attempt to seek out new highs or new lows as it rotates. Thus, if this current upside move fails to establish new highs above this resistance zone, then it must move lower to attempt to establish new lows. This means the $40 price target is a very viable immediate objective.
Global demand for oil, as well as global economic data, could be key to understand the future demand and price for oil. At this point, a new upper fractal top formation will generate new Fibonacci price targets to the downside. If our opinion proves to be correct, we will learn of these new price targets within a few weeks.