
Talking Points
- Gold and Silver Reclaim Lost Ground As The US Dollar Falters
- Copper And Crude Oil Bolstered By Chinese Manufacturing Beat
- Platinum Eyeing The 1,314 Floor Following A Slide Under 1,360
The precious metals have managed to recover some lost ground in Asian trading today as their pricing currency the US dollar falters. Manufacturing PMI figures from the world’s largest economy due over the session ahead may offer the greenback some guidance. The leading indicator is tipped to climb to the highest on record. This in turn may firm Fed policy normalization bets and reinvigorate the USD bulls, which in turn could renew pressure on gold and silver.
Meanwhile, crude oil and copper have been bolstered by a better-than-anticipated September HSBC China Flash Manufacturing PMI reading released today. The lift in the gauge of manufacturing sector activity may have alleviated concerns over a waning appetite for commodities from the Asian Giant. A strong US PMI figure later in the session would offer a positive signal for global demand for growth-sensitive commodities. Yet a recovery for crude may prove difficult given the lingering worries over a supply glut.
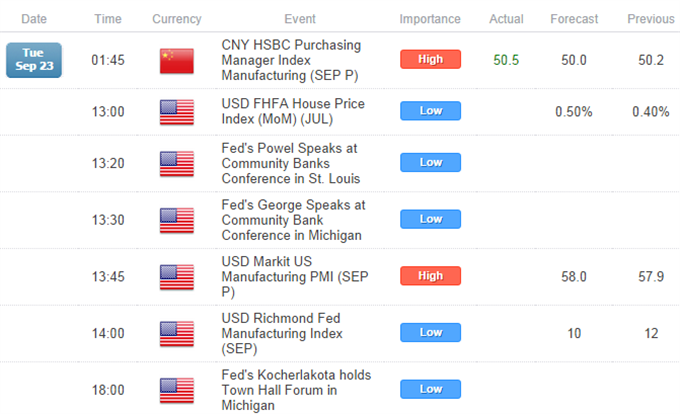
ECONOMIC DATA

CRUDE OIL TECHNICAL ANALYSIS
Crude is once again at a critical juncture as it teases at a push below the 90.20 barrier. Against a broader bearish backdrop a daily close below the noteworthy level would be seen as a fresh selling opportunity. This would pave the way for the next leg lower to the 2013 lows near 85.45. At this stage reversal signals appear lacking, which casts some doubt on the potential for a recovery.
Crude Oil: Revisits 2014 Lows

GOLD TECHNICAL ANALYSIS
Downside risks remain for gold while sub the 1,222 barrier. A Doji indicates some hesitation from traders to lead the precious metal lower. Yet the absence of classic reversal candlesticks lowers the likelihood of a corrective bounce at this stage. This keeps the spotlight on the 2013 lows near 1,180.
Gold: Break Below 1,222 Barrier Offers Fresh Short Entries

SILVER TECHNICAL ANALYSIS
Silver has formed a Hammer formation after tapping the 17.30 target offered in yesterday’s report. However, the key reversal candlestick awaits confirmation from a successive up-day before suggesting the potential for a recovery. Against the backdrop of a sustained downtrend on the daily, a corrective bounce would be seen as an opportunity for fresh short positions.
Silver: Recovery May Prove Difficult Amid Broader Bearish Backdrop

COPPER TECHNICAL ANALYSIS
Copper has slid under the 3.08 floor, opening a knock on the next barrier at 3.01. A downtrend appears to be emerging for the base metal given the signals offered by the 20 SMA and Rate of Change indicator. However, recent price action has been relatively choppy, warning that a smooth ride lower may be difficult.
Copper: Breakout Below Triangle Bottom Casts Risks Lower

PALLADIUM TECHNICAL ANALYSIS
The presence of a short-term downtrend for Palladium warns of further weakness for the precious metal. The daily close below the 50% Fib (805) opens the door to a run on the May lows near 792.
Palladium: Downtrend Warns Of Further Weakness

PLATINUM TECHNICAL ANALYSIS
Platinum’s woes have worsened in recent trade as the precious metal continues its slide towards the 2013 low target of 1,314. Within the context of a sustained downtrend on the daily and absence of key reversal candlesticks a recovery is questionable.
Platinum: Targeting 2013 Lows Near 1,314
