Get 40% Off
🚀 AI-picked stocks soar in May. PRFT is +55%—in just 16 days! Don’t miss June’s top picks.Unlock full list

Crude Feb In Sideways Trend, Resistance At 6265-285 Levels

Published 02/17/2014, 05:42 AM
Updated 05/14/2017, 06:45 AM


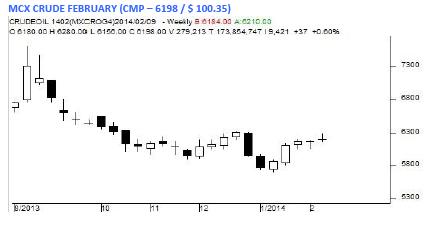
MCX Crude February as seen in the weekly chart above has opened the week at 6180 levels initially moved sharply higher, and as expected found good resistance at 6280 levels. Later prices fell sharply towards 6156 levels and finally closed higher from the previous week closing levels.

For the next week we expect Crude prices to find support in the range of 6145 –6125 levels. Trading consistently below 6100 levels would lead towards the strong support at 6048 levels and then finally towards the major support at 5963 levels.

Resistance is now observed in the range of 6265-6285 levels. Trading consistently above 6315 levels would lead towards the strong resistance at 6390 levels, and then finally towards the Major resistance at 6453 levels.

MCX / NYMEX Crude Oil Trading levels for the week

Trend: Sideways
S1- 6145/ $ 99.20 R1-6265 / $ 101.45
S2-6048/ $ 98.00 R2-6390/ $ 102.55

Weekly Recommendation: Buy MCX Crude February between 6145-6135, SL-6080, Target -6265.

Latest comments

Loading next article…
Risk Disclosure: Trading in financial instruments and/or cryptocurrencies involves high risks including the risk of losing some, or all, of your investment amount, and may not be suitable for all investors. Prices of cryptocurrencies are extremely volatile and may be affected by external factors such as financial, regulatory or political events. Trading on margin increases the financial risks.
Before deciding to trade in financial instrument or cryptocurrencies you should be fully informed of the risks and costs associated with trading the financial markets, carefully consider your investment objectives, level of experience, and risk appetite, and seek professional advice where needed.
Fusion Media would like to remind you that the data contained in this website is not necessarily real-time nor accurate. The data and prices on the website are not necessarily provided by any market or exchange, but may be provided by market makers, and so prices may not be accurate and may differ from the actual price at any given market, meaning prices are indicative and not appropriate for trading purposes. Fusion Media and any provider of the data contained in this website will not accept liability for any loss or damage as a result of your trading, or your reliance on the information contained within this website.
It is prohibited to use, store, reproduce, display, modify, transmit or distribute the data contained in this website without the explicit prior written permission of Fusion Media and/or the data provider. All intellectual property rights are reserved by the providers and/or the exchange providing the data contained in this website.
Fusion Media may be compensated by the advertisers that appear on the website, based on your interaction with the advertisements or advertisers.
© 2007-2024 - Fusion Media Limited. All Rights Reserved.