As warned, crude oil prices continue to falter and briefly broke $40 per barrel on Friday. Prices have weakened as the outlook for a global slowdown continues to spread. Despite evidence of weak demand and increasing rig counts, E&Ps are still pumping near all-time levels, which is not beneficial for higher prices.
The price action in commodities over the last year have been nothing short of a bloodbath as insidious speculation unwinds. This is having profound impact and spreading through other markets. Commodity-based companies are watching their odds of debt default skyrocket due to this great unwinding of commodity prices. Credit spreads from Asia's largest commodity trader, Noble Group (OTC:NOBGY), are widening to 2009 highs. Glencore (LONDON:GLEN), sensitive to prices in base and precious metals, as well as crude, is seeing credit risk explode higher.
Commodity based stocks have been monkey-hammered lower. For instance, copper and gold producer Freeport-McMoran's (NYSE:FCX) common shares were sitting at $36 a year ago, and as of Friday's close traded under $10.
Even if one takes the energy sector as a whole, credit spreads have widened to an all-time high by pushing through 1,100 bps.
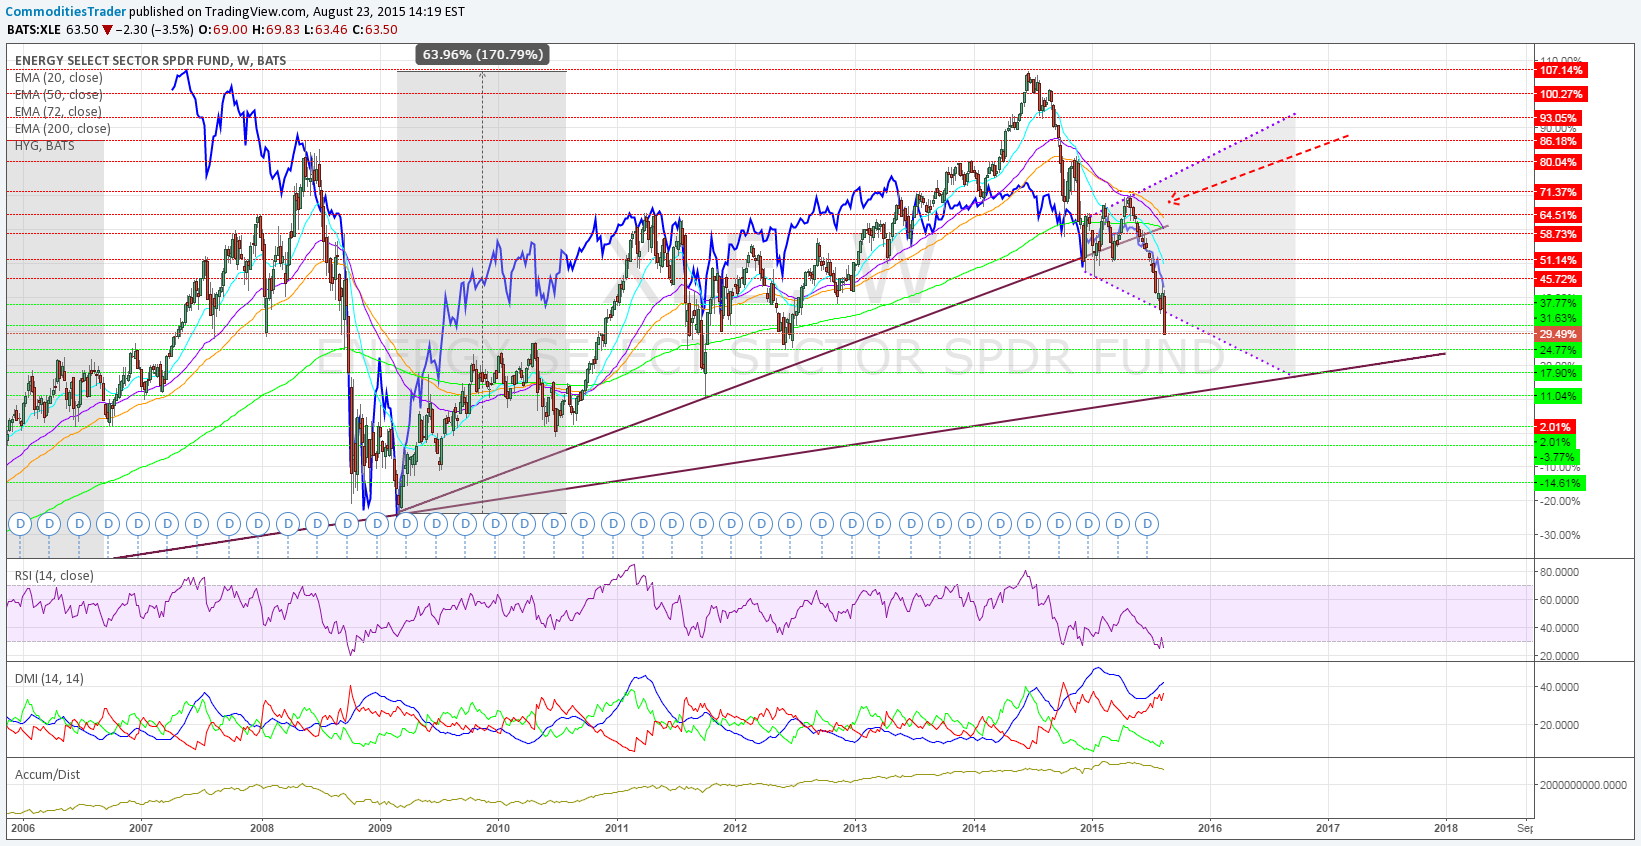
In my article "The XLE Broke Significant Support on Crude Price Woes," the divergence of industry health and Wall Street's need to "buy on the dip" was evident. The energy-based ETF was primarily gobbled up do to being "battered," and it serves as a dividend play.
Personally, I cannot count the number of times Wall Street "pros" have called for a bottom, while spouting the "transitory" nature of lower crude prices. Nevertheless, I pointed out that it was about to get much more battered. The price action supported the idea that it was technically broken, after breaking key support levels. On August 16, I tweeted that "either credit conditions improve or energy stocks will crash." By the end of the week, there was near capitulation in the energy space.

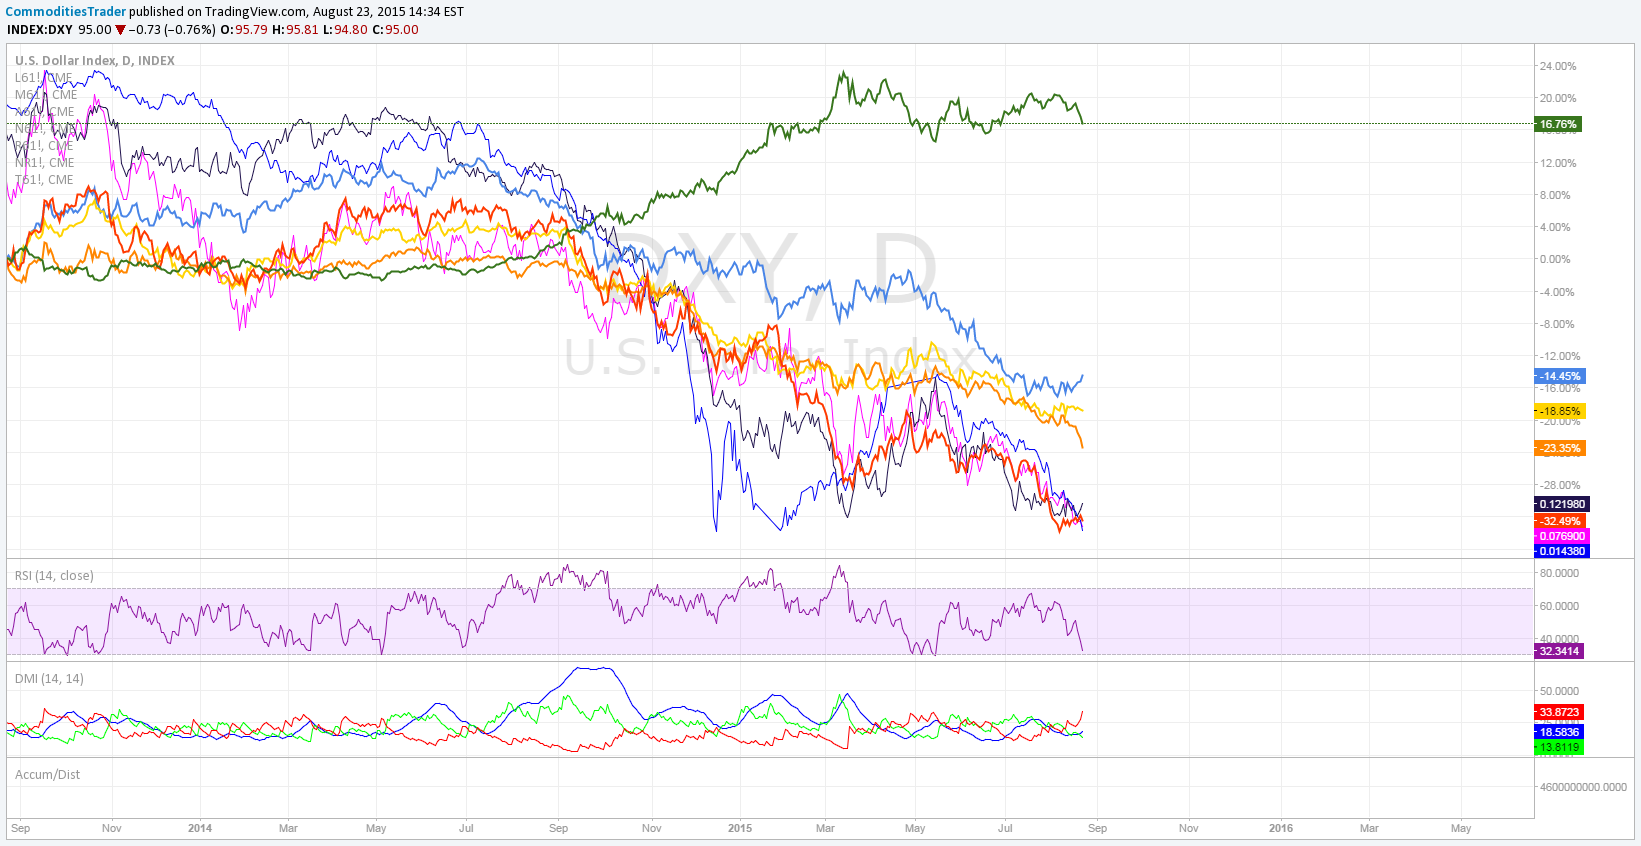
The collapse in oil, and other commodity prices, is wrecking havoc within commodity based economies, which is causing implications in the foreign exchange markets. Commodity based currencies have plunged anywhere from 15 to 35 percent since 2014. All are seeing severe threats to their economic growth.

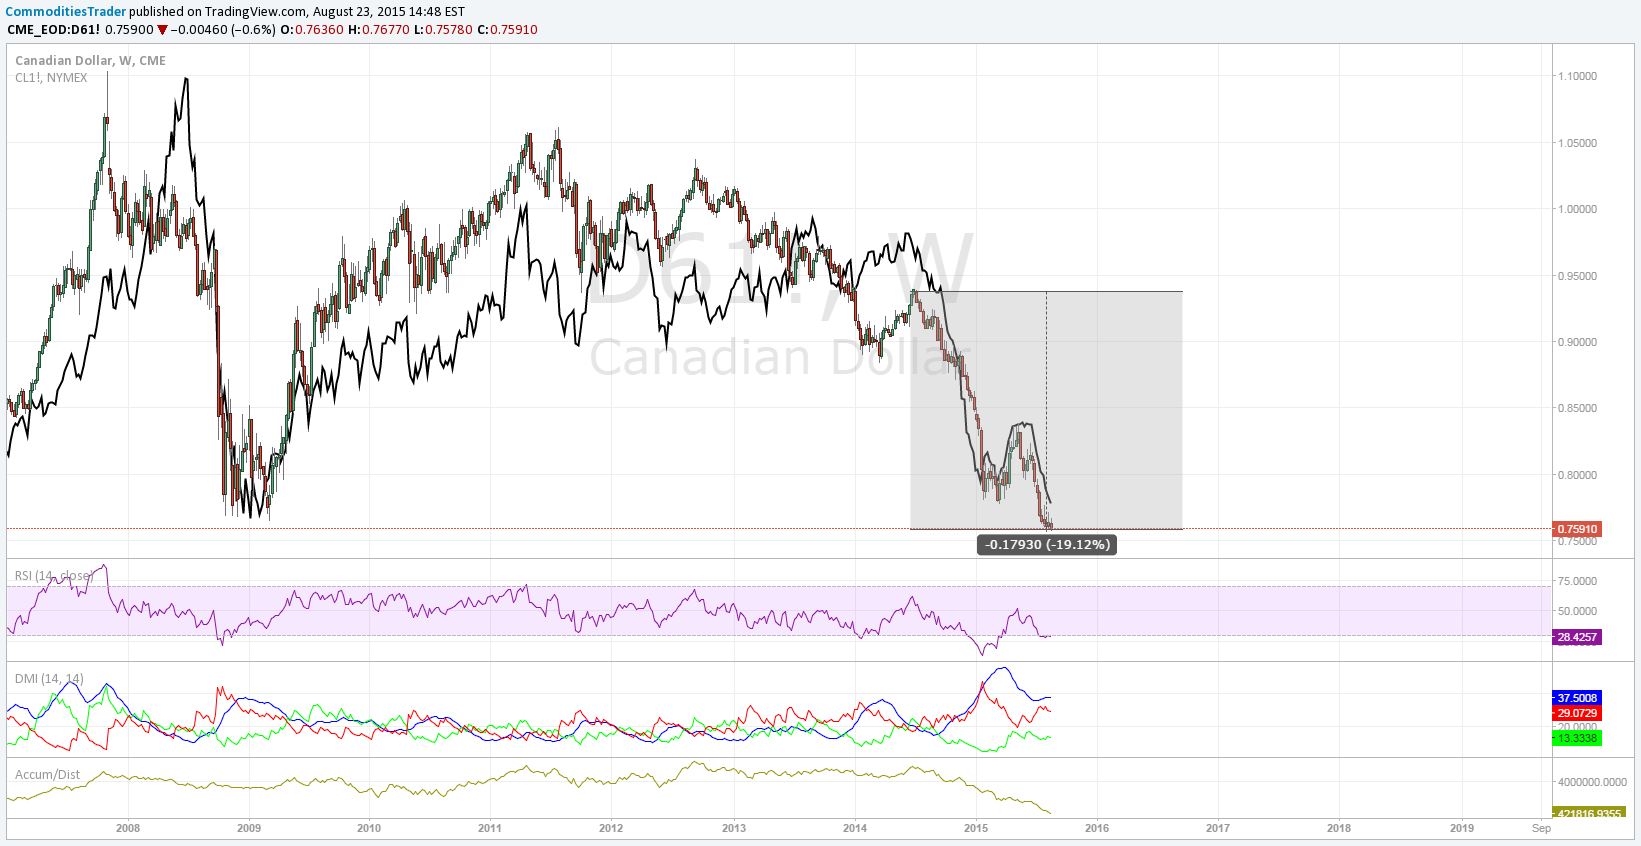
Canada has probably been the worst hit out of all developed economies. Crude is the nation's leading export, and the collapse of crude prices caused the collapse of the Canadian dollar, which hit an 11-year low against the dollar.
As one can see, the Canadian dollar has been highly correlated to crude future prices:
Due to lower crude prices, the Conference Board of Canada has issued their worst growth forecast since 2009. "We expect the numbers to show economic growth tracking close to zero in the second quarter, as the economy flirts with recession. But even if Canada slips into mild recession, we expect it to be small and short lived," according to the associate director of national forecast, Matthew Stewart.
Of course they expect it to be short lived. Nobody wants a recession to be indefinite, but the disconnect still remains that this is not just an isolated problem, the entire world is slowing down. Canada pumps 2.2 million barrels per day and most of their oil sands are losing money.
Everyone expects this huge rebound in oil prices. Why? For what reason? It is unfathomable that oil can remain lower for longer, but considering everything as a whole, it just may.
Western Canadian Select crude, the nation's heavy benchmark, is trading under $25 per barrel.
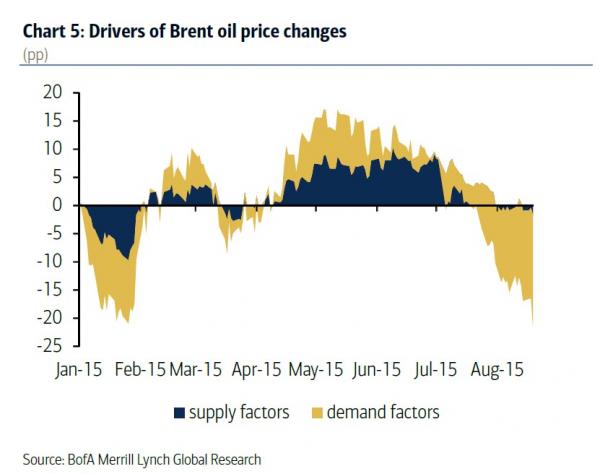
According to Bank of America Merrill Lynch (NYSE:BAC) Global Research, demand factors are playing a huge role in the latest oil collapse.

Global trade has been stagnating, and with China's economy heading into the doldrums, it's about to get worse. Without demand, higher inflation (or extreme shortage) seems to be the only logical support for oil prices. Inflation forecasts are being heavily cut as five-year inflation break-even have hit five-year lows.
Oil production, globally, has surpassed 80 million barrels per day. The point to where expectations meet reality is fast approaching. Since this is a bubble of debt expansion, Austrian Economist Ludwig von Mises said:
"There is no means of avoiding the final collapse of a boom brought about by credit expansion. The alternative is only whether the crisis should come sooner as the result of voluntary abandonment of further credit expansion, or later as a final and total catastrophe of the currency system involved."
