Global stock indices continued to collapse, setting the stage for their worst week since the 2008 financial crisis, as the fast spreading of the virus-related disruptions and economic effects are threatening to throw the globe into another recession. Wall Street felt the heat the most, with all three of its major indices tumbling more than 4%. US Treasury yields continued to slide as well, while investors increased bets with regards to additional rate cuts by the Fed.
FINANCIAL WORLD STAYS IN PANIC MODE AS VIRUS-SPREADING ACCELERATES
The dollar traded mixed against the other G10 currencies on Thursday and during the Asian morning Friday. It gained against NZD, CAD, NOK, AUD and GBP in that order, while it underperformed against JPY, CHF and EUR.
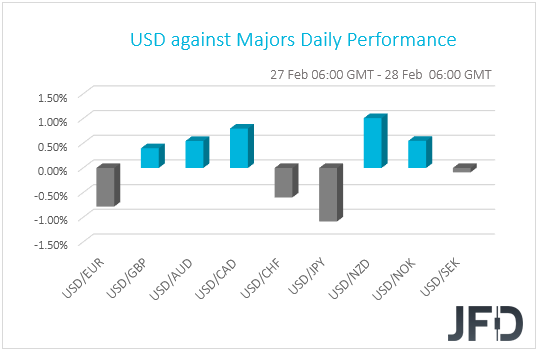
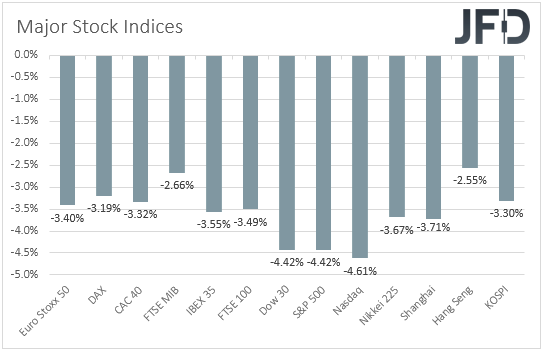
The strengthening of the safe havens yen and franc and the weakening of the risk-linked currencies Aussie and Kiwi suggest that the flight to safety continued and this is more than confirmed by turning our gaze to the equity world. Global stock indices continued to collapse, setting the stage for their worst week since the 2008 financial crisis. Wall Street felt the heat the most, with all three of its major indices tumbling more than 4%. The S&P 500 tumbled 4.42%, its largest percentage decline since August 2011, while the Dow Jones, also falling 4.42%, recorded the biggest point drop in its history. It fell 1190.95 points in just one session. Nasdaq fell the most in percentage terms, 4.61%, which is equivalent to 414.30 points, closing 12.7% down from its record closing achieved on February 19th.
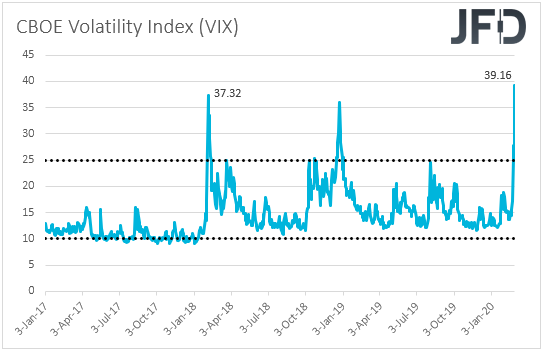
At this point, it is worth noting that the CBOE volatility index (VIX), also known as the “fear index”, surged to 39.16, well exiting its 10-25 “normal range” of the last few years, and surpassing its February 2018 peak of 37.32.
The culprit was no one other than the coronavirus. The epidemic continued spreading at a fast pace, with the number of cases staying in acceleration mode and reaching a total of 83113, while following a few days of slowdown, deaths accelerated as well, hitting 2858. Worries over China’s failure to contain the virus within its boarders continued to heighten. According to market reports, nearly 10 nations reported their first cases, while deaths in Italy, the European country that is hit the most, rose to 17 yesterday, with the number of cases surging from something more than 200 to 650. In Germany, France and Spain, the numbers of infected people are 27, 18 and 15 respectively, while in South Korea, the nation with the most infections outside China, the confirmed cases advanced to 2022.

It seems that investors remained in a panic mode, as the fast spreading of the virus-related disruptions and economic effects are threatening to throw the globe into another recession. In the US, although the spread between the 3-mont and 10-year Treasury yields has narrowed back to -15, yields along the whole curve continued to tumble, with the 10-year rate hovering near its record low of 1.30. On top of that, investors brought forth their expectations with regards to further easing by the Fed. On Tuesday morning, we noted that they were anticipating one cut in June and another one in November. Yesterday, the closings of the Fed funds futures yields were pointing to nearly one in April and another one in July. That said, this morning the CME Fedwatch tool assigns a 90% chance that the Fed will decide to pull the easing trigger at its upcoming gathering, which is scheduled for the 17th and 18th of March.

As for our view, we stick to our guns that the worst is not over yet. Scientists have warned that the virus could spread more easily than previously reported, while yesterday, they noted it remains unknown how long the virus can survive on surfaces, which, as a consequence, leaves unanswered a lot more questions over the virus’s spreading, and keeps uncertain whether and when it could be contained. With reports suggesting it may take at least 12-18 months for a vaccine to be developed, we repeat that the economic wounds may not be as temporary as previously believed and may well drag into Q2.
With regards to the markets, we expect investors to continue abandoning equities and other risky assets, like the risk-linked currencies Aussie and Kiwi, as they seek shelter in safe havens, like the yen, the Swiss franc, gold, bonds and perhaps the euro. Yes, the euro. The common currency was found the second winner in line, which suggests that it may have been used as a vehicle in carry trades, due to Eurozone’s negative interest rates. Namely, it may have been borrowed for buying other currencies, like the US dollar, in order to invest in risky assets, like US stocks. With investors now unwinding massively such trades, extra-low yielding currencies are getting benefitted. Even if risk assets rebound somewhat due to this week’s overstretched decline, we would not try to catch a falling knife. We prefer to treat such a bounce as a corrective move before the next possible dive.
Bearing in mind the fact that it is the world’s reserve currency, the dollar may also wear a safe-haven suit. However, given the aggressive bets over more cuts by the Fed, we prefer to avoid exploiting any USD strength against other safe havens. It would be better to do that against the risk-linked currencies, like the Aussie and Kiwi. Due to the slide in oil prices, the greenback could also perform well against CAD and NOK, the nations of which are largely dependent on oil production and exports.
Having said all that, our best gauges of risk sentiment remain the combinations of a risk currency against a safe haven, like AUD/JPY and NZD/JPY. Indeed, NZD/JPY was the worst performer among pairs consisting by G10 currencies.
NASDAQ 100 – TECHNICAL OUTLOOK
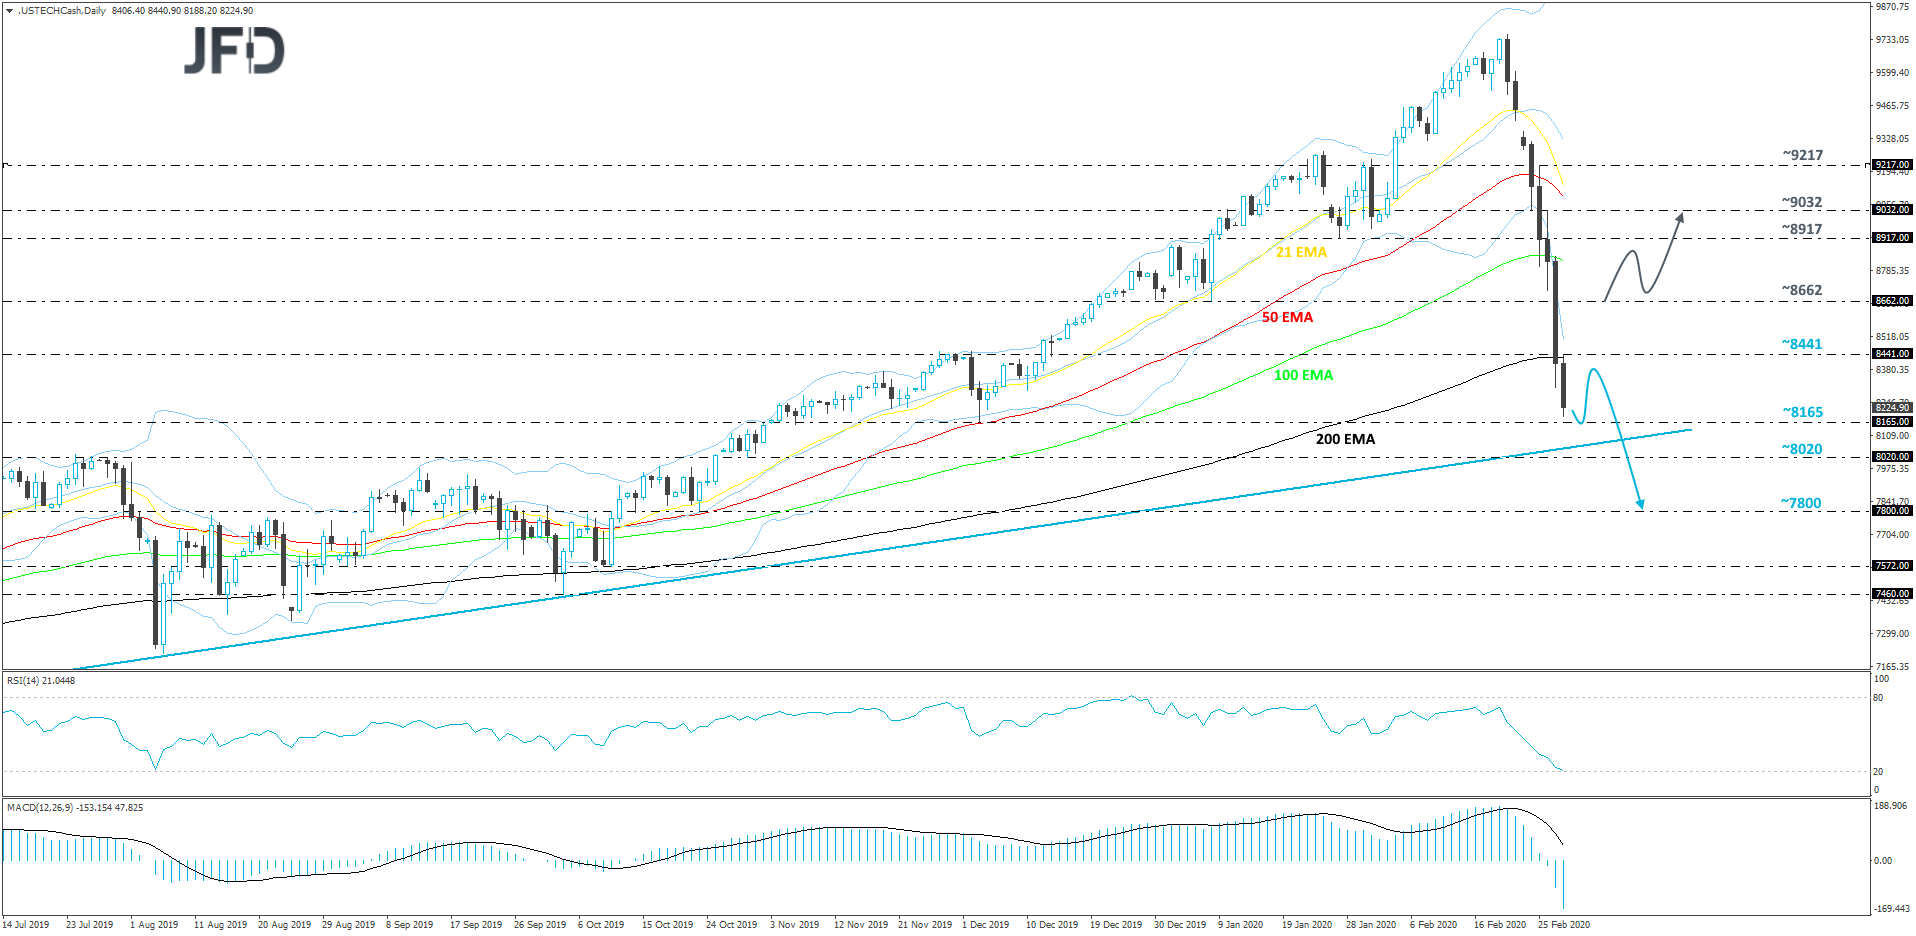
The Nasdaq 100 index continues to get hammered this week together with the rest of the global indices. Looking at the technical picture, we can see that the price continues to slide heavily every day. Now, the index is getting close to its medium-term upside support line taken from the low of June 2019. Even if we see a small pullback, for now we will continue aiming lower, this is why from the short-term perspective we will stay bearish, but we will take a cautious stance near that upside line.
The Nasdaq 100 cash index may continue drifting south, where it may end up testing the lowest point of December, at around 8165 hurdle. The area might help support the price temporarily, possibly leading to a small rebound. However, given the current negative sentiment in the market, the retracement up could be short-lived, especially if the index struggles to get back below its 200-day EMA. If so, Nasdaq 100 may resume the current downtrend and end up testing the aforementioned upside support line, or the 8020 obstacle slightly below it. If the selling continues, this may push the price even below the psychological 8000 territory, where we may then aim for the 7800 level, marked by the low of October 23rd.
On the other hand, if the index travels back above the 200-day EMA, or even the 8662 barrier, marked by the lows of December 30th and January 8th, this could invite a few more buyers into the game. Such a move may help lift the index to the 8917 hurdle, a break of which could set the stage for a re-test of the 9032 level, marked by Wednesday’s high.
NZD/JPY – TECHNICAL OUTLOOK
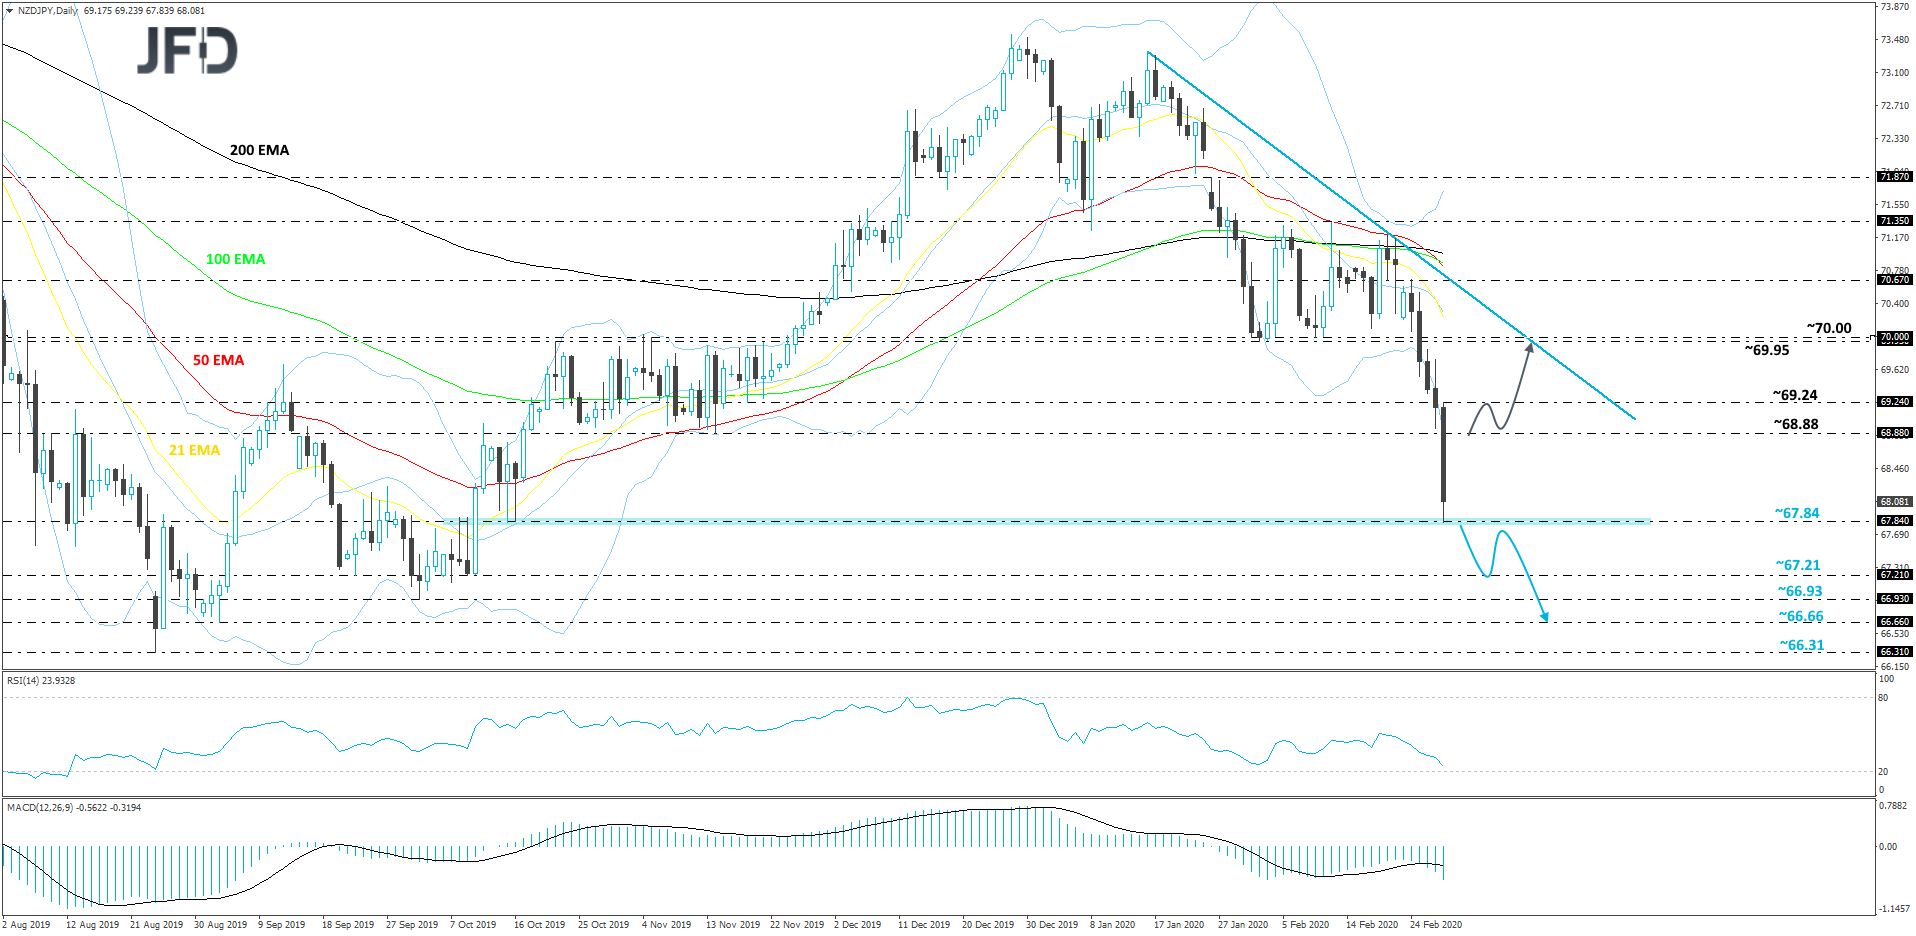
NZD/JPY sold-off heavily overnight, falling below the November 2019 low, at 68.88. Now the pair is testing one of its key support areas, at 67.84, which is the low of October 15th. The rate is also trading well below its short-term tentative downside resistance line drawn from the high of January 16th. Although we may see a small rebound at some point, the trend is still to the downside, hence why we will stay bearish, at least for now.
Given that the 67.84 hurdle is currently providing some decent support, we would like to see a break of that area before considering a further move lower. If we do see such a move, then we will target the next potential support zone, at 67.21, which is the low October 9th, 2019. The pair may rebound from there, but if it finds it difficult to travel back above the 67.84 barrier, this could result in another round of selling. If this time the 67.21 obstacle breaks, that would confirm another lower low and the next levels to consider might be at 66.93 and 66.66, marked by the lowest point of October and the lowest point of September, respectively.
Alternatively, if the pair retraces back above the November low, at 68.88, we may be seeing a larger correction to the upside. If so, the rate could get lifted to the 69.24 hurdle, marked by today’s high, a break of which could set the stage for a push to slightly higher areas. That’s when we will aim for the 69.95 zone, or the psychological 70.00 level, marked by the lows of February 3rd and 10th respectively. That is the area where the rate could end up testing the previously-mentioned downside line, which may provide additional resistance.
AS FOR TODAY’S EVENTS
Although investors are most likely to keep their gaze locked on developments surrounding the coronavirus, there are some noteworthy releases on today’s agenda.
During the European day, Sweden’s GDP for Q4 is coming out. Expectations are for the qoq rate to have declined to 0.0% from +0.3%, but this would drive the yoy one up to +2.0% from +1.6%.
From Germany, we have the preliminary inflation data for February, The CPI rate is expected to have held steady at +1.7% yoy, while the HICP one is expected to have ticked down to +1.5% yoy from +1.6%. This may raise speculation that the headline rate of the Eurozone as a whole may also held steady.
Later in the day, the US personal income and spending data for January are coming out, alongside the yoy rate of the core PCE index, the Fed’s favorite inflation gauge. Personal income is expected to have accelerated to +0.3% from +0.2%, while no forecast is available for spending. The case for accelerating income is supported by the acceleration in average hourly earnings for the month, while the increase in the retail sales rate may result in a similar move in the spending one. With regards to the core PCE rate, it is expected to have ticked up to +1.7% yoy from 1.6%.
Last, but not least, we have Canada’s GDP data for Q4. The qoq annualized rate is forecast to have fell to +0.2% from +1.3%.
