Get 40% Off
👀 👁 🧿 All eyes on Biogen, up +4,56% after posting earnings. Our AI picked it in March 2024.
Which stocks will surge next?
Unlock AI-picked Stocks

Copper In Sideways Trend, Selling Recommended

Published 05/05/2014, 06:36 AM
Updated 05/14/2017, 06:45 AM


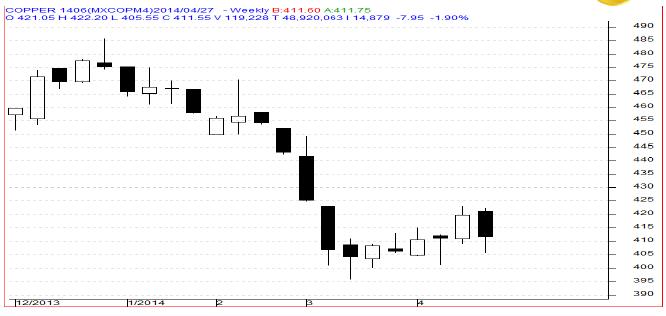
MCX Copper June as seen in the weekly chart above has opened at 421.05 levels and during this week prices made a high of 422.20 levels. During this week prices corrected sharply towards the low of 405.55 levels and at the end of the week prices bounced back from near to the support of 405 levels and finally closed 1.90% lower on 411.55 levels. During this week prices have closed below previous week’s closing of 419.50 levels and as per candlestick it formed a “Bearish candlestick” pattern which indicates bearishness.

For the next week we expect Copper prices to find support in the range of 405 – 404 levels. Trading consistently below 404 levels would lead towards the strong support at 398 levels and then finally towards the major support at 392 levels.

Resistance is now observed in the range of 420 - 422 levels. Trading consistently above 422 levels would lead towards the strong resistance at 427 levels, and then finally towards the major resistance at 434 levels.

MCX / LME Copper Trading levels for the week

Trend: Sideways
S1 – 404 / $ 6,620 R1 – 420 / $ 6,880
S2 – 398 / $ 6,520 R2 – 427 / $ 7,000

Weekly Recommendation: Sell MCX Copper June between 418 – 422, SL- 427, Target – 405 / 404

Latest comments

Risk Disclosure: Trading in financial instruments and/or cryptocurrencies involves high risks including the risk of losing some, or all, of your investment amount, and may not be suitable for all investors. Prices of cryptocurrencies are extremely volatile and may be affected by external factors such as financial, regulatory or political events. Trading on margin increases the financial risks.
Before deciding to trade in financial instrument or cryptocurrencies you should be fully informed of the risks and costs associated with trading the financial markets, carefully consider your investment objectives, level of experience, and risk appetite, and seek professional advice where needed.
Fusion Media would like to remind you that the data contained in this website is not necessarily real-time nor accurate. The data and prices on the website are not necessarily provided by any market or exchange, but may be provided by market makers, and so prices may not be accurate and may differ from the actual price at any given market, meaning prices are indicative and not appropriate for trading purposes. Fusion Media and any provider of the data contained in this website will not accept liability for any loss or damage as a result of your trading, or your reliance on the information contained within this website.
It is prohibited to use, store, reproduce, display, modify, transmit or distribute the data contained in this website without the explicit prior written permission of Fusion Media and/or the data provider. All intellectual property rights are reserved by the providers and/or the exchange providing the data contained in this website.
Fusion Media may be compensated by the advertisers that appear on the website, based on your interaction with the advertisements or advertisers.
© 2007-2024 - Fusion Media Limited. All Rights Reserved.