🚀 AI-picked stocks soar in May. PRFT is +55%—in just 16 days! Don’t miss June’s top picks.Unlock full list

Copper April In Sideways To Down Trend

Published 03/10/2014, 03:17 AM
Updated 05/14/2017, 06:45 AM


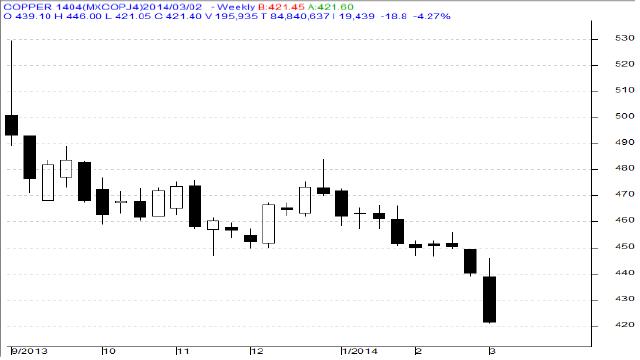
MCX Copper April as seen in the weekly chart above has opened at 439.10 levels and during this week it rallied sharply higher towards 446 levels but could not sustained on resistance level and corrected back towards 421.05 levels and making the new contract low levels. We have observed that during this week prices fell sharply 4.27% lower and finally closed at 421.40 levels.

For the next week we expect Copper prices to find support in the range of 414 – 415 levels. Trading consistently below 414 levels would lead towards the strong support at 407 levels and then finally towards the major support at 403 levels.

Resistance is now observed in the range of 430-432 levels. Trading consistently above 441 levels would lead towards the strong resistance at 447 levels, and then finally towards the Major resistance at 452 levels.

MCX / LME Copper Trading levels for the week

Trend: Sideways - Down
S1 – 414 / $ 6670 R1 – 432 / $ 6970
S2 – 407 / $ 6560 R2 – 441 / $ 7110

Weekly Recommendation: Sell MCX Copper April between 430 - 432, SL- 441, Target - 414 / 410.

Latest comments

Loading next article…
Risk Disclosure: Trading in financial instruments and/or cryptocurrencies involves high risks including the risk of losing some, or all, of your investment amount, and may not be suitable for all investors. Prices of cryptocurrencies are extremely volatile and may be affected by external factors such as financial, regulatory or political events. Trading on margin increases the financial risks.
Before deciding to trade in financial instrument or cryptocurrencies you should be fully informed of the risks and costs associated with trading the financial markets, carefully consider your investment objectives, level of experience, and risk appetite, and seek professional advice where needed.
Fusion Media would like to remind you that the data contained in this website is not necessarily real-time nor accurate. The data and prices on the website are not necessarily provided by any market or exchange, but may be provided by market makers, and so prices may not be accurate and may differ from the actual price at any given market, meaning prices are indicative and not appropriate for trading purposes. Fusion Media and any provider of the data contained in this website will not accept liability for any loss or damage as a result of your trading, or your reliance on the information contained within this website.
It is prohibited to use, store, reproduce, display, modify, transmit or distribute the data contained in this website without the explicit prior written permission of Fusion Media and/or the data provider. All intellectual property rights are reserved by the providers and/or the exchange providing the data contained in this website.
Fusion Media may be compensated by the advertisers that appear on the website, based on your interaction with the advertisements or advertisers.
© 2007-2024 - Fusion Media Limited. All Rights Reserved.